Wednesday, December 28, 2011

Santa is gone?

Santa gave us a quick visit, which is pretty much 12/19 to 12/28 (early this morning on global ES basis). Not sure if Santa is totally gone or not. Personally I am not in trading mood this week. My scalping position was unloaded at the close of yesterday 12/27. My hourly ES chart actually thinks the top was in at 10:00 of 12/27 and calling this morning's high as bull trap.


Today's chart is another example of volatility, as we went from overbought to oversold in just couple hours this morning. The VIX is heading up. Is it usual? Well, I think it is not unusual recently. With a serious oversold condition and thin volume, this market has not much room to go down. My best guess is we are heading toward another bumpy trading range. We may see some higher highs, then collapse in new year. I don't believe 2012 is the end of human race, but it could be the end of some man-made so called civilization such as EURO or modern financial system.

HAPPY NEW YEAR!!!

Thursday, December 22, 2011

Movie night

Rather than watching another sitcom, better take a look at this.
Here are some movie trailers from the 'trading category' productions, it's always nice to see it (if You know more, post it here too!)

Inside Job (I watched this one already and bot a BluRay for collection. Highly recommended.)


Too big to fall


Margin Call


Wall Street: Money never sleeps

Wednesday, December 21, 2011

What does Santa tell you

Last night, early this morning, futures reached 1249 as compare to Monday low at 1195 or a 4.5% rally in just 1 trading day plus the extended hours. Is it you Santa?

On the news, the long awaited LTRO is out.  LTRO, stands for long term refinance operation, is actually ECB print 645b Euro and lend to 523 banks in a 3 year term. In the market, the bulls are having problems lifting the market above the resistance levels, while the bears still feel “confused”.

Here is an interview with John Taylor, who is founder, chairman and CEO of FX Concepts, the world's largest currency hedge fund. It is a very good interview. I summarized a few points below:

1. LTRO is QE in another form in Europe
2. It is a short term solution to a long term problem
3. This is a solvency crisis, not a liquidity crisis. Printing will not work. (You give a broke guy a credit card instead of a job)
4. Germany is doing so well that wreck Euro and EU
5. Greece, Spain and Italy to leave EU or Euro zone. “We are losing at least one, that is Greece in 2012”.
6. Global recession ahead in 2012. US will get a mild one.
7. EURO will go to 1.12 and possibly 1:1 (now trading around 1.31, a 17% drop)


Wednesday, December 14, 2011

Where is Santa

The Fed didn't do anything. Following my plan, I stopped out on Tuesday. Not sure if it is right or wrong, but as I conservative investor, I think I should stand on the side or a moment.
I am using $VIX the volatility index as one of my major indicator. Usually it is inversely correlated with SPX, the broad market index. In my late November plan, I was trying to harvest VIX dry out. Unfortunately, in recent movement, both VIX and SPX were going lower together. Below is a chart posted by Cobra summarizing the recent occurrences of this situation. According to Cobra, the situation VIX down 0.8% while SPX also down happened 17 times in the past 2000 trading days (roughly 10 years).

http://www.cobrasmarketview.com/wp-content/uploads/1213_109B2/VIXDownOnSPXBigRed.png

I guess I am not very lucky on this one. At this moment I really really miss Santa.

What I did wrong is Gold. I should stop out earlier. I started to think of it couple weeks ago, but I didn't take action. Gartman is right. Gold very likely will under-perform equity for the next couple months. The reason could be the fall of EU and Euro will send US Dollar higher, while Gold as an alternative currency is priced in USD and will get a direct hit. US Equity is priced in USD too but the impact will not be that significant, since US economy will "stand-out" anyway on the fall of EU.
I see the slow down of selling activities in the market. I will find an exit.

Tuesday, December 13, 2011

Quick Update 12/13/11

I see top sign everywhere, every market. Ironically, with price fluctuating, VIX didn't move higher. I don't quite understand what it means. I don't think we have room to go down at this moment since FED is holding a meeting now and will make announcement tomorrow. Maybe, maybe Wall Street is just pushing Ben for it.
BUT, the volatility makes me uncomfortable. As a conservative investor, I am thinking of Risk-Off at this moment.

Here is the condition:
If FED failed to deliver (or hint), and SPX failed to take out recent high at 1265 by the close of Wednesday 12/14/11, I will exit Equity, and I will hold Gold for a little bit longer.

Friday, December 9, 2011

Life is good

Life is good. I get all I asked for.
I asked for a correction on 12/8. I got it! I asked for 1220.91 (based on ES which is the emini futures for SPX) and I got 1222.75 last night. What's next?

Dear Santa, I want to sell my long ES around Christmas for at least 1280s. I think the next couple weeks will be rough. I am expecting a choppy melt up to 1280-1310 area.


Thursday, December 8, 2011

Something Interesting - 12/8/11

Here is Gartman's interview with cnbc. There are not too many people i trust in the market. Gartman is surely on the list. (He is very expensive. :( )


Here is the Colby letter:
The S&P 500 Composite (SPX: 1,261.01) absolute price rose to challenge the highs of the previous 2 trading days and its 200-day SMA on 12/7/11, only to reverse to the downside in the final minutes, again failing the test of resistance.

As I have been noting here, SPX appears to be encountering resistance near its 200-day SMA, now at 1264.00 and declining fractionally every day.

Because the 200-day SMA is so widely followed, predatory traders might try to plant more late-day false rumors, which appear to be mindlessly reported by the gullible media, in an effort to close SPX above its 200-day SMA, in order to trigger buy orders to sell into. Note that since 1/3/2000, of the 106 instances of the SPX closing above or below its 200-day SMA, 88% of the 200-day SMA crossover signals would have resulted in a loss, going both long and short, following the trend in the direction of the crossover.

Short-term price momentum oscillators have stalled out. Longer term, the 50-day SMA has remained bearishly below the 200-day SMA every day since 8/12/11.
Do you see what he is saying? Last time it was the FT rumor. Yesterday it was the NIKKEI. Yes, it is dirty. All things are ON. BUT, what are you expecting?

On Economy itself.
Here is a good summary of the EUR crisis by Reuter.
http://graphics.thomsonreuters.com/11/1 ... tings.html

More things I am reading. Here is  
"Why Gold Stocks Have Underperformed Gold"


Wednesday, December 7, 2011

A technical research report from a major broker

THE Underperformed BS stole my idea!!!!!!!!!!!

Still Bullish but Overbought

US Trading: The concerted action from central banks has been extending last weeks rally but with our short-term momentum indicators reaching overbought extremes as well as moving into initial price resistance the SPX is getting vulnerable for profit taking. Early this week we expect a test of the 200-day moving average at 1265 but given the increasingly overbought stance and the unsustainable momentum we wouldn’t be surprised to see a pullback later this week/next week towards 1220 before starting a final rally into deeper December.


The November 25th reaction low at 1158 remains a pivotal support as it represents a higher low versus the early October low. As long as the market trades above this level the short- to medium-term price structure remains constructive. On the upside we have a strong resistance area at 1292 (late October high) to 1304, which we still expect to be tested into deeper December. From a trading standpoint we maintain a bullish bias although at the end of the day we are talking about the last 3% on the upside before a meaningful setback starts into January. So all in all we would concentrate on selling into further strength instead of chasing the market. Into late January we expect at least a re-test of the late November low at 1158.

US Strategy: In our early October strategy call we said that from the October 4th low we expect the SPX to start a corrective (a-b-c) countertrend rally that should finally unfold in a volatile sideways trading range into deeper Q1 before resuming the underlying bear market into the second half 2012. The critical level for this call was and remains the October 4th low at 1074; as long as the SPX trades above this level we have no reason to change our underlying tactical strategy. Again, if we are correct then it is unlikely to see any bigger trend moves developing over the next few weeks, which means the market remains pretty much trading oriented and therefore a sell into any kind of stronger rallies.


Tuesday, December 6, 2011

Tom DeMark's interview on 12/5/2011

In the interview with bloomberg y'day 12/5, Tom Demark is calling for a rally to 1330-1340 with time stamp 12/21.


On 12/4 i made a blog post saying:
I will keep my longs thru the entire traditional Santa Rally. My perfect case scenario is:
a. correction to the end of this week (12/8)
b. next rally leg to the end of this year (12/28 or 12/29)
If you check the rally end date, we are only 3 trading days off. and the 3 days are actually around the Xmas holiday with expected irrelevant trading activities. Let's see how it goes.

As I disclosed I think myself a Demarkian. How do u like my way of showing respect to my teacher?:mrgreen:

btw, Tom is also 2011 Technical Analyst of the Year
http://technicalanalyst.co.uk/conferences/Awards11.htm

Good job Tom.

Sunday, December 4, 2011

LMP 12/2011 and quick read of market

Just a quick recap of Dec LMP status incase I didn’t mention it on 11/30.

The 5 IVY portfolio components are 
  • SP 500 (Risk ON)
  • MSCI EAFE (The Most Famous International Index) (Risk OFF)
  • U.S. 10-Year Government Bonds (Risk ON)
  • NAREIT (U.S. Real Estate Index) (Risk OFF)
  • SP GSCI (Goldman Sachs Commodity Index) (Risk ON)
My current hold includes:
20% US equity (SPY), 40% mid-term bond (LTPZ), 20% gold (GLD),  20% money market (UUP)
My current approach uses only ETFs. I will think of Mutual Funds once things getting cool down.  In my practice, I went long on Gold via the gold ETF GLD to replace the Commodity component for now.

In current month's reading of the 6 components (5 original plus Gold), Bond and Gold are green, and the other 4 are red. In my last post, I summarized why I take Equity position despite the Moving Average signal is still negative. If you still remember, last month REIT actually turned green, but I overrode the signal, as disclosed here. This month it turned back to red. I didn't say too much about why, but I did spend some time on the topic. I may think of some specialized Real Estate investments, but not general term in the next couple months.

It is hard to tell what's going on next.  The Elliott Wave guys online are all turned bearish. Here are examples: 


Early episode:
Low Maintenance Portfolio - Nov 2011

Wednesday, November 30, 2011

Technical 11/30/11

The last day of 11/11.

This is a very special month. This is so far the only month I took mid-month action since I started Low-Maintenance Portfolio in 2007. Things are changing too fast. We just got the worst Thanksgiving week since 1932. Now we got a super good week right after. At least we can say, we are experiencing the history.  Below is a summary of my thoughts in Nov.

On Nov 1, in Low Maintenance Portfolio - Nov 2011
I put down my plan:
I may think of add equity in the middle of the month if MF turned out to be a plain BK and Europe turn out to be not worse.

On 11/14, in What's going on?
My plan: I still need to cast more due diligence on the possibility of Year-end rally. Currently I still think it will come this year. I want to participate into a rally from 1220-1235 to 1400-1440 if everything is perfect.
In Quick Update 11/19/2011, which is posted on EST 11/18,
Now bulls' only hope is the channel to hold, which is also coincident with 50% retracement at around 1185. I think we will arrive there next Tuesday, 11/22/11 (+/- error term). 
In Art or Science, I posted my state of art chart, and gave a target of 1230s.

Not patting myself in the back, but it is just a detailed flowchart on how I think loud here, refine my plan step by step then execute it. My time series analysis gave me 11/22/11 as turning point, which is 1.5 days off. I don’t blame myself for that. From the chart, best entry point was Friday 11/25/11, yes the half day session on Black Friday.

---------------------------------------------- Forward looking Divider -----------------------------------------------

My mid-term target to be 1230ish which was reached overnight. To be honest, I don’t know what’s going on next. Quick changes do have a lot of impact to chart reading. I decide to do a technical Wednesday to conclude the month of 11/11.

Here is an update of my channel chart. As I mentioned, I was expecting 50% retracement, but in fact it did a clean 61.8% in the historical thanksgiving week. I tend to ignore the dip as I think it is overreaction from retails with very light volume. On Monday close, we did get a rally to pair out the loss of the thanksgiving week, and closed at 50% level at 1185 again. If we offset Wednesday and Friday loss by Monday’s huge gain, the chart makes more sense. Interestingly now we are at the top of the channel again. In fact SPX took a tiny little peek. Will it be a break out?


Here is my cloud chart. It has a long Japanese name that I can not quite remember. It is a very famous and extremely useful tool. There are tons of discussions, webpages, blogs, traders on it. For a detailed study, please refer to my friend Bob’s wiki page. Here I am showing a variant I picked up online. I always use cloud to check the trend and the quality of it.


Cloud gives a clear view. Ever since fast cloud dip below slow cloud in 11/16, /ES is declining in a clean regression channel. Things changed Sunday night. A gap up based on better than expected Black Friday Sale triggered overdue rebound. Last night fast cloud penetrated into slow cloud and found support there. Early this morning, the Bail Out World news sent ES to my target.
My mid-term target was from 1230 (in the rainbow chart) to 1243.5 above. This morning we did open and hang around 1230 for couple hours then a small wedge sent us to 1245.
Is it good or bad? We still have chance to see 1280 which is my target of extreme, but I won't give high weight on this scenario.
The 2 long, light blue hourly bars are too thin, not strong enough to hold further rally. Check the Price and Volume relation marked in the red box.
Oscillators are also not supporting further one side movement.
I am expecting a correction around 1220 area to digest the recent quick profits.

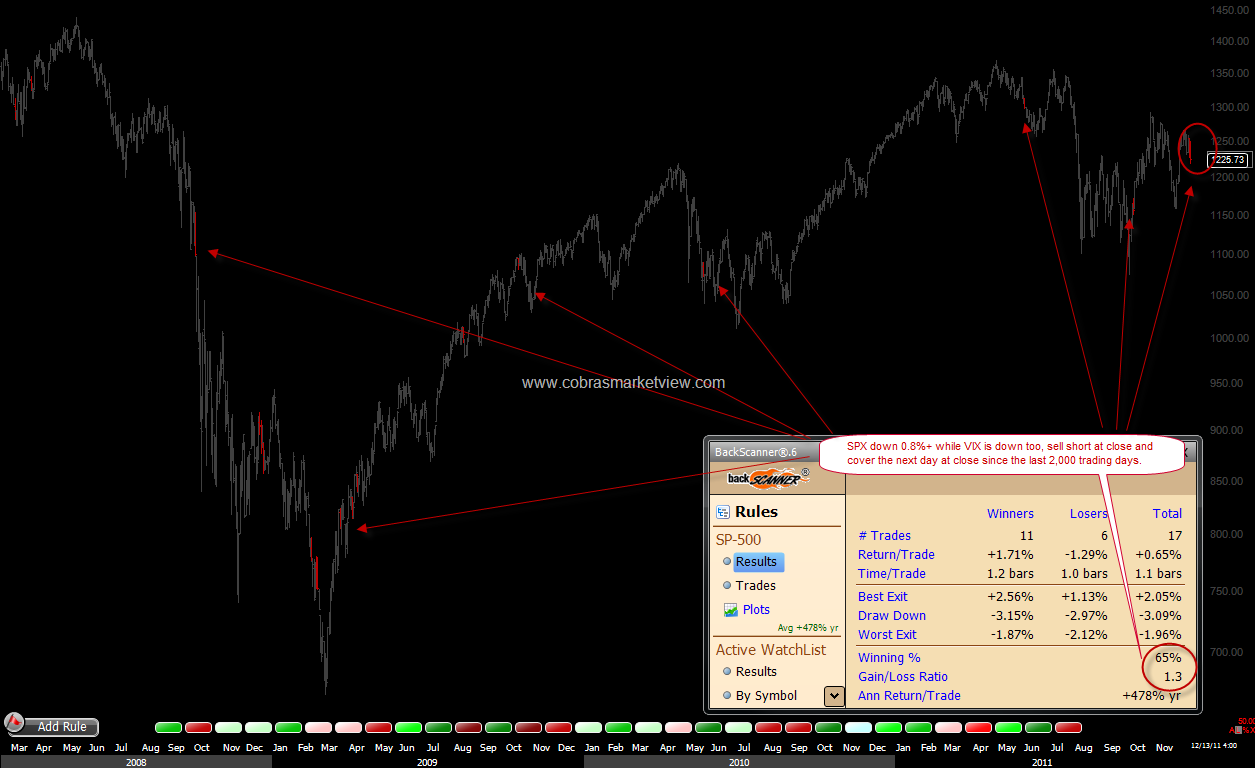
Ever since I learned volatility couple years ago, it is always my most powerful weapon in my personal arsenal. This is my volatility study by comparing VIX with implied Volatility. I am expecting a volatility dry out to the end of the year.

Monday, November 28, 2011

Stocks continue to slide as Wall Street suffers worst Thanksgiving week since 1932 - NY Daily News

Not sure what did others do. I just got a lazy Thanksgiving. The unexpected dip then reverse pattern actually has impact to my intermediate-term plan. I will discuss it further tonight.

Stocks continue to slide as Wall Street suffers worst Thanksgiving week since 1932 - NY Daily News

Tuesday, November 22, 2011

Art or Science

If I can choose when and where to be born (I am not complaining about my mom), it will not be hard to me. Even though 18-19th century Britain is very competitive with some big names such as Charles Darwin, Adam Smith, Issac Newton, I will still pick the renaissance 1500, Italy. Raphael, Michelangelo and, Leonardo da Vinci!!! Yes!!! Below is from WIKI.
Leonardo di ser Piero da Vinci ( pronunciation (help·info)) (April 15, 1452 – May 2, 1519, Old Style) was an Italian Renaissance polymath: painter, sculptor, architect, musician, scientist, mathematician, engineer, inventor, anatomist, geologist, cartographer, botanist and writer whose genius, perhaps more than that of any other figure, epitomized the Renaissance humanist ideal. Leonardo has often been described as the archetype of the Renaissance Man, a man of "unquenchable curiosity" and "feverishly inventive imagination".

When I mentioned Leonardo, what’s the first image jumps into your mind? To me, it is Mona Lisa. She is so famous that she has her own spot on wiki.

Couple days ago, NPR, 1 of my favorite radio station discussed a very interesting topic,
Here is the Leonardo's To-Do List
 

Thank god. Check this guy’s list. What a jumble! Cannons, wall construction, studying the sun, ice skating in Flanders, optics, and that oh-so-casual, "Draw Milan." It's like his mind could wander off in any direction at any time.

To traders, another master piece should not be ignored. Very frequently I see people debating whether trading is science or art. Da Vinci gave us the answer, there is no mutually exclusive polarities between the sciences and the arts. Vitruvian Man is a perfect example.


Fibonacci, golden ratio, harmonic numbers, all things together, we have this mater piece.

Here is my right brain practice by applying left brain technique. Happy Thanksgiving.


###########################################
It is already year end. If you are planning for donations, please consider wikipedia and NRP. Every dollar counts.

11/22/11

As I said, I want to give an update on 11/22. My evil plan is working (so far). I read a double bottom around spx 1185 level.

Is it a tradeable bottom? I don't know, but as a "doer" rather than a thinker, I turned on the risk for 50% of my equity money. Let's see what's going on.

Happy Thanksgiving. Try 1 of my favorite game, Fed Chairman. Have fun.

Friday, November 18, 2011

Quick Update 11/19/2011

As we discussed couple days ago, we are at the bifurcation. It could be a wedge which usually is a continuous pattern or a channel which is stronger and pointing down. The wedge is surely broken.


You gonna love Fibonacci numbers. We stopped right at the 38.2% of this rally, or in my words, bear market correction. Now bulls' only hope is the channel to hold, which is also coincident with 50% retracement at around 1185. I think we will arrive there next Tuesday, 11/22/11 (+/- error term).

Monday, November 14, 2011

What's going on?

How is the past week? If you just read the numbers, it was pretty much flat. Dow opened at 11983, and closed at 12153. But if you check the intraday, you will find DOW actually travelled 1000 points in the past 3 days. And yes it was right after I posted my notes on volatility. Zerohedge has a good summary.
With today's volume over 30% below average (and the lightest since July), the week ended on an up note as the Dow managed to gain just over 1% having meandered well over 1000pts to get there.
I have to say I am a little bit surprised. Is it over? Is it totally fine now? After we compelled couple whipping boys to resign, now the entire world is clean and clear. BUT, we have a little bit tiny problems here. First let’s look at EUR/USD. We know EUR has good positive correlation with equity. The correlation was very high since summer, because the crisis is from Euro-Zone anyway. Why EUR is not as bullish as US Equity?


 In the chart, I showed my zone to short in oval, but EUR hadn’t made there yet. In other words, EUR had not recover from the loss from 11/9 yet, while SPX made over 1.5% gain if considering the overnight trading just happening now.Here is a chart I found online, which explained my thoughts.


I expect them to convergent in short period of time. The only thing I am not sure is direction. Recall my “conspiracy QE“, beat down EUR is an easing to the US equity.

The other thing is the quality of the rally of US Equity. This is another chart I found online.

The author, Kimble says, “So whats new today compared to Monday morning? Not much... some new leaders have been put in place in Europe and key resistance lines remain!”

add: My chart on DOW


This is a 30 minute chart of Dow-30. From the chart we can see how indecisive the market is. The peak line is pretty clear. If it is a channel marked by red line, then market should correct to 11,500 area. If it is a triangle marked by light blue, it will be a weaker pattern. It could either go up from now or retrace to the low bound of the triangle then go up.

My plan: I still need to cast more due diligence on the possibility of Year-end rally. Currently I still think it will come this year. I want to participate into a rally from 1220-1235 to 1400-1440 if everything is perfect.

Wednesday, November 9, 2011

Bold Prediction?

People love to make bold predictions. Then they tend to forget the bad ones.

Nov. 8 (Bloomberg) -- Neel Kashkari, head of global equities at Pacific Investment Management Co., talks about the outlook for global financial markets. Kashkari speaks with Betty Liu and Dominic Chu on Bloomberg Television's "In the Loop." (Source: Bloomberg)

What is Volatility

What is volatility?
A friend asked me to clarify and quantify volatility I am talking about. For a more standard definition, you can find any finance textbook. Let’s discuss a little bit of my understanding here. In the financial and economy market, the No. 1 key word is expected / forecast / predictable. For every major econ or fin activity, there are bunch of analysts covering it. They will forecast it and the range of the forecast will be priced in before the event. Risk is defined as a departure of the forecast, to either side. A significant and constant departure actually means difficulty of forecast. If there is so much uncertainty in the near future, people tend to be “risk-off”.

Here is an example of predictable price behavior.

If the market is efficient, we should expect fluctuation. People need to have different opinions to form a buy-sell opportunity. Overall, treasury stays in its price channel with manageable movement. Overall in a long run showing in this chart, you roughly can make 300% easy and comfortable return over 30 years of time. The chart on bottom has a totally different look. It did not want to stay in lane, raised too fast and ruined the price channel. The damage was in 2000 and we are still paying it back.
In the stock market, an easy proxy of risk and volatility is moving average and standard deviation. Statistically, 2 Standard Deviation explains 95% of the movement in a normal distribution.
Standard deviation is also important in finance, where the standard deviation on the rate of return on an investment is a measure of the volatility of the investment.

Based on this concept, John Bollinger designed an indicator called Bollinger Bands. The default setup is 20 period moving average as the middle line and 2 STD on each side. Just think of it like a 2 lane road. When you are on the road, you want to be a nice driver. You should make yourself predictable, not too fast or too slow, stay in your lane. If the car in front of you is not only speeding, but also playing a zigzag game, hitting the shoulder on the left then hit the curb on the right, what do you think? I will take the closest exit and find the nearest Starbucks for a break. After things cool down, I will go back to the road again.
How about opening gaps? Gaps are caused by overnight trading in other markets such as Asia and Europe. If gaps are too big and too often, that is also a kind of volatility I don’t want to deal with. So the car in front is actually transformer. Instead of keeping on change lanes, this car is jumping from left to right.
Here is a chart showing some recent reckless driving of SPY which is the Electronic Trading Fund for SP 500 index and a good representative of the overall market. 


Check the details. How many times it hit the curb? How many times it was driving off-road? How many gaps that I cannot handle?
AGAIN, in a long run, it is not how much money you make, but the risk management, or how much money you avoid to lose, that protects you. Inflation and interest rate adjusted peak is in year 2000, unadjusted peak is 2007. If you buy at peak, you are still losing money.


Tuesday, November 1, 2011

Low Maintenance Portfolio - Nov 2011

Short summary: Long 40% bond, 20% Gold, 40% money market.

No I don't buy it. I don't like the market movement despite a crazy October. I shall always remember my research with a guy COB. It is not how much money you make but how much you avoid to lose counts in a long enough term. Cash is still king. I put another lot (20%) into mid-term bond, holding Gold from last month and have the remaining 40% in cash.
Recently the seasonality shows trend turn every month and extreme every Monday. The market is far from being stabilized. 1255 was my upside correction target. I believe last weeks rally above 1255 are all short-covering. I count it as wave 2 peaked at spx 1293. I am expecting bigger movements in front.  I think spx need to revisit 1074 which is the low of this year.
Interestingly, when I was googling fancy wallpaper, I found this chart.


Don't know who the author is, but I like it and decide to post the link here. Tip off. :D

This month REIT actually turned positive, but again I don't want to buy it. Here is a report from Big Picture indicating a soft housing data. There is nothing wrong to play conservative. I will at least wait for another month.

Other evidence including the MF bankruptcy news such as this one, and my reading on EURO chart below:


Closing statement: November will be interesting. I may think of add equity in the middle of the month if MF turned out to be a plain BK and Europe turn out to be not worse.

Early episode:
Low-Maintenance-Portfolio-2
Low-Maintenance-Portfolio-1
The Ivy Portfolio”.


BTW, somebody keeps on asking me about AAPL even though I keep on telling him/her I am not going to cover AAPL anymore. Anyway, here is a picture for that person. enjoy :D


Thursday, October 6, 2011

In Memoriam: Steve Jobs


Heartbreaking news about Apple CEO Steve Jobs. Is it for real this time? In 2008 Bloomberg mistakenly declared his death once. I really wish it’s another mistake by media again. Words are entirely and perilously inadequate.

From Apple website


Tuesday, October 4, 2011

Quick Update on Apple

I don't want to be too micro on this blog. It is just the market movement is too fast.
In my early post Update-on-AAPL, I put down a target of AAPL to the rang of 371-390. Today's low was 370. I believe my correction target has been met.  AAPL is at a bifurcation now.
Today 10/4/11, around 1:00 ET, Apple is going to announce an iphone event. If it is ip5, I will still hold it. All plans are still on. If it is just an update or upgrade to iphone 4, I will close my position.

Tuesday, September 27, 2011

Low Maintenance Portfolio - 2 (Market Reading 9/27/11)

Last Friday before close, I raised the question: "where the money go?"

something fishy. gold and silver crashed, but where the money go? not in bond not in equity. i want to follow the smart money, but i first need to find them.
a conspiracy interpretation, they r waiting for the meetings this weekend. with the money escaped from metal market, i will say it could easily push spx up for 100-120 points to like 1240-1260. of course the measurement will be similar if heading down.

Now is time to look back. With the extreme bearish sentiment in the market, where the bulls have become bears,where my favorite trader since yesterday is calling the collapse of the World with GS ruling, the set up for a huge squeeze is here. as I expected, the move up this morning was brutal, and killed many of the new “smart” shorts.
Technically since SPX hit 1195 level, which is just inch shy to my minimum target of 1198-1200 , the rebound can be considered satisfied. I think the brutal part is gone. It may move up a little bit or just correct at current level. It will be a small possibility case that SPX to challenge 1240-1260 maximum target.
How is the portfolio going? As I discussed in Low-Maintenance-Portfolio-1, I am using the approach introduced by Marc Faber, detailed in his book “The Ivy Portfolio”. Here is the recap of my allocation:
  • I exited both US and emerging market equity on 7/28 (see part 1), 
  • I exited long Gold position on 8/23 when I sent out the "Dear Mr Bond" letter. 
  • I am still holding 20% DBC (commodity) and 20% IEF (7-10 years). 
  • I added back GC (gold) Monday around 1630 to play a rebound. If the crisis goes on, Gold should not stay below 1730.
  • I did day trading on ES (equity), but decide not to add to my long term portfolio for this month, even with my short term bullish view above
Interestingly, I found a CNBC interview with Marc Faber on 9/26/2011 3:00 EDT. Pay attention to the time stamp. Since he is in Hongkong now, the interview is before the Monday market open.


If you are really impatient, fast wind to 1:17. Marc said he expected a short term rebound of Equity this week, but he is not going to buy, since he is expecting a drift lower toward last year low of 1010. He would be happy to buy equity below 1100. He also said Gold is very oversold. He plans to buy in the next 2 days. Stupid CNBC put down:

Marc Faber, author of the Gloom, Boom and Doom Report, tells CNBC that he thinks gold could fall to $1,100 an ounce 
Marc doesn't think the market is down because of Greece, which is an insignificant player of the world economy. It is just the symptom of the problem.  He also hit China on slow down, possible aftermath of infrastructure expasion, etc.

WOW. All spot on. Now we are talking! Do you see how close our views are? Now you understand why I recommend him as my only recommendation? (For the record, not one of my recommendation, but my only one.)

I will surely follow up in the coming month.

Sunday, September 25, 2011

Words after 9/21/2011 FED - (1)

I discussed my expectation of FED's 9/21/2011 meeting HERE. They didn't do much except the widely expected Yield Curve Twist approach. You know, Ben is a famous "meet-expectation" guy. Market got disappointed on the underwhelming reaction. A sell-off was followed, which made last week one of the worst in recent months. Before I jump onto the analysis of the twist, let’s start with the reality check (outline).

1.       Recovery from the Abyss: This is the most severe economic upheaval since the great depression 1929, with Epicenter in the severe housing downturn. The unprecedented damage spread to largest asset/credit class:
  • Highest employment loss percentage since 1940s
  • Deleveraging on a global scale
  • Collapse of some of the largest financial institutions in the world
  • Unprecedented government intervention in an attempt to provide stability

2.       U.S. Banking Industry Stabilized but Still Fragile ….
  • a)      Credit metrics appear to have peaked but remain an industry burden
  • Credit loss cycle may have a second leg
  • b)      Capital has been raised to stabilize balance sheets
  • Incomplete at regional and community level
  • 90% of TARP has been repaid but 491 banks still hold TARP ¹
  • c)       Bank loan demand in place but sluggish
  • Lack of “shadow banking” industry may spawn re-intermediation
  • d)      392 banks have been closed by 865 remains on the FDIC’s problem list
(Source: FDIC September 2011)

3.       Regulatory Reform and Pace of Economic Recovery Remain Big Variables ….
  •       Significant economic hurdles ahead
a.       Structural problems remain: Leverage and unemployment
b.      Housing unresponsive
c.       Inflation taking root
d.      Significant long-term interest rate risk
  •          Regulatory reform just beginning to unfold
a.       Increase in required capital levels and renewed emphasis on common stock as dominant form of capital
b.      Reduced fee income and rising regulatory and compliance costs disadvantage those without sufficient scale

4.       Summary of FDIC’s Quarterly Banking Profile (2Q11)

Industry posted net income of $28.8 billion, eighth consecutive quarter of year-over-year improvement. Wait, you think I am an angle delivering great news? The ugly truth is:
  • Lower loan loss provisions were principal source of increase; net operating revenues declined for the second consecutive quarter (cooking the book)
  • Half of all institutions reported declines in non-interest income, while non-interest expenses were 6.1% higher than a year ago (spend more, make less. Sounds familiar.)
  • Average ROA was 0.85% for all institutions, 0.57% for community banks (I can do better than that)
  • 15% of insured institutions reported a loss for the quarter (My tax money will go there soon)
  • Non-current loans declined for 5th straight quarter to $320 billion (they are not lending)
“Problem List” saw first decline since 2006, now 865 institutions with total assets of $372 billion
Source: FDIC

Now comes with the Recession/Recovery question: Slow Climb Out or Double Dip?

I believe the Key Elements of Recovery is still Job growth. Only if people get a fairly paid job and don’t worry about next month’s paycheck, they will become consumers again. At this moment, they are still looking to de-lever, which will curtail spending. Only if people have job, they will think of housing. 
But it is still not enough for the housing market. I spoke with a fellow from FDIC last week. He told me he covers south east region. Atlanta, GA, for example, has 20 years worth of house inventory. This is the reality. Do you think it will go away or recover on its own? When I was in school studying Macro Economics, it said in the Great Depression, farmers pour milk into the sea because they cannot find a way to sell them and they cannot afford the storage costs. Now what? It’s not milk, but houses. Demolish them? Low interest rate will help the builders haunting around for a little bit longer, but they are not anywhere near recover. Ben of the FED, Tim of Treasury, Whitehouse (no name), whoever, whatever, they need to provide a basket of “creative” solutions to housing debacle. 

Tuesday, September 20, 2011

Update on AAPL

On July 18, I made a post AppleMania. At that time I projected a 3 wave movement, up to 390, pull back to 350 then rally to 420.


Today AAPL finally reach my target at 420. AAPL is bulletproof for sure. Broad market down 5% while AAPL is up about 30%. It is now the largest public company listed on US market.
All 3 parts of my projection realized pretty well. This appears to be my best so far. Other than patting my back and saying good job, I want to update my view.


I think it has 2 scenarios, either go up to 445 or go down to retest the triangle break out. Personally I am more leaning toward a correction that will be due soon. Today I started to utilize covered calls to manage my position. I will hold it a little bit longer. Rumor says iPhone 5 will be delivered on 10/15. I will determine whether to hold or not based on the length of the line waiting outside the Apple store.

Monday, September 19, 2011

Words before 9/21 FED

Call me Evil because I am. There is no QE3 on Jackson Hole, and market rumored about a new FED activity on 9/21 FED meeting. Where we are? Do we need a new QE? Will there be a new dose? I will provide a detailed report later. Let me quickly jump to conclusions for now.

1. The US economy is in terrible shape.
2. We need some kind of cure but a QE limited in capital market (as we had, twice) will not help.
3. Will we get anything good tomorrow? NO. You think the Euro zone crisis started last night? You think Greece started to struggle recently? You think Italy is recently added to PIIGS? If your answers to all above are Yes, then I have to say you are screwed. Why existing issues got amplified recently? Because our friends from DC and NYC need us, general public, to switch gear. A resolution is due but they don’t have anything yet. What to do now? Somebody just find some more creative ways, such as pressing the Euro crisis button. By burning euro down will not do anything good to our economy, except to increase the value of US dollar on comparative basis. Are we in bad shape? Yes we are. But the rest of the world is even worse. On comparison we are still OK. We are forcing those surplus nations (actually I mean China) to keep on buying Treasury products. Gold and precise metal market is not big enough for them, and oil will tank on the rise of $$$. Where can they go?
I don’t think we will get any easing tomorrow simply because we are already in one. They will keep those wording to maintain the imagination / expectation as topping/dressing. Nothing more. If you ask me, it is all preset deals, it is all conspiracy.

Sunday, August 28, 2011

Low Maintenance Portfolio, Ivy-like (1)

Back couple years ago, I worked with a guy whose name is COB. Other than our day time job of playing around with derivatives, we had bunch of discussion on how to handle our 401K investment. We are not trying to time the market or anything like trading, but rather, we want to find a more systematic way to maximize our return and avoid major drag down. Since life is already very heavy to us, we cannot really afford a lot of time and effort of watching the market, reading the news, drawing the charts, blahblah. We came up with some idea of so called “Low Maintenance Portfolio”. Our requirements can be summarized below:
-  
 
  • Contains only Short Term bonds and Equity, which are suitable and available for all 401K plans, other retirement plans, and all full scope investment portfolios;
  • Bonds are considered “out” mode. If there is any doubt, we will get out of risky asset classes and park in short-term bonds. Since we are not really investing in bonds, but rather take it as safe haven to avoid drag-down or high risk, long term bond or high yields are not that attractive to us;
  • Equity allocation will need s little bit further work to determine category, such as market cap, international or domestic, and industry;
  • Monthly allocation, usually at month end;
  • We started using GS estimation of GDP as our trigger for in or out decision. Later I expand the criteria to moving average.

How are we doing? I successfully escaped in late September 2008 (which is actually the trigger of this study), exit again in July 2010 and July 2011. Yes I have 4 years of double digit gains in my 401K, the 4 unforgettable years. Clearly this way works. What we need to do is just to refine a little bit.
Couple months ago, I read a book, “The Ivy Portfolio”.


It discussed a lot on how those Endowments Funds of Yale and Harvard are structured and maintained. Those Ivy schools’ Endowments are famous for professional management. People are claiming of “Equity-like return with Bond-like volatility”. Yes, this is what I am looking for.

-- To Be Continued

Thursday, August 4, 2011

Jackson Hole 2011

Couple months ago, I out together a chart on the roadmap (of how the US is dropping into and staying a hole)

http://readingtowin.blogspot.com/2011/03/whats-next.html

Now QE2 ended. Now the market is talking about QE3. Will history repeat? In my Behavior Finance class, I learned it's human to make mistakes; it's human to repeat the mistakes; it's human that nothing changed in the past couple million years.


Here is my updated chart. US market is not closed yet. SPX is currently defensing 1210.
add: I feel I need to add today's market action into my chart.
Dow recorded largest drop since Dec 2008.
SPX: largest drop since feb 2009.
We now back to nov 2010.

God bless America!

Thursday, July 28, 2011

On Economy

I found something interesting on web. I want to document it here for future reference.


Unread postby ocassional observer » Wed Jul 27, 2011 4:05 pm
john hussman has a list of conditions that have preceded or coincided with recessions 100% of the times:
·         10 yr treasuries below 6 month ago-V,
·         spread 10 yr-3yr bonds smaller than 3.1%-V, 
·         ISM manufacturing under 54-V,
·         nonfarm payroll growth less than 1.3% from a year ago-V,
·         a widening in spreads between corporate and treasuries from 6 months ago (i use barron's confidence index instead)-V
·         and the last- equity markets lower than 6 months ago- on the verge.
Here is the website of John Hussman. I am going to do more research on him and his study. In general, I like his ideas.

Today, ocassional observer posting another interesting post.
I would like to point your attention to a little followed indicator called the credit suisse fear barometer. a peak in this indicator as led every peak in the market by ~7 days since the beginning of the year. it has recently confirmed an intermediate top by falling dramatically as the 6m graph shows.

CSFB 6m.png

a 5y chart shows that we are at heightened levels similar to the one that preceded the bear market start in 2007.

CSFB 5y.png

i believe a break down of this indicator below the 20 level will sign, together with the economic indicators i mentioned at yesterday's close, and what i now believe is a confirmed dow theory sell signal from the beginning of july, the start of a bear market and a coming us recession.
the indicator is updated daily at bloomberg several hours after the close:http://www.bloomberg.com/apps/quote?ticker=CSFB:IND
a definition exist there as well.

Again I like this idea too. I will keep on monitoring this indicator for further analysis and application.

Monday, July 18, 2011

Applemania

I am not a fan of any i-crap. No java, no flash, no silverlight, no USB, no SD, no nothing. What am I going to do with it? Anyway, the market is full of idiots eager buyers / fans of Apple products.

I do like the chart of AAPL. As a matter of fact, I bot the stock on 6/22. Well, I have to admit it is some kind of lucky.

My projection from 6/22 stated a target of 377, which appears to be toooooo conservative. I currently read a flag breakout (@362) and raise my target to 420. If the ER is good, we may see it very very very soon.
Good luck and Happy trading.

Thursday, June 9, 2011

SPX

So far the ABCD pattern on SPX played well. I see an immediate target at 1325 before next week, which is OE.

Monday, June 6, 2011

USD and SPX

I expect some kind of bounce of USD then a break down of the bottom trend line to mark the end of 5 waves on weekly. The low, however, should not exceed the bottom setup in 2008.
After that, USD is going to have a LIFE. Well, I have to admit, it depends on whether we are going to have a QE3 or same kind or not.


SPX is on the opposite.  I see an a-b-c broken down rather than a 5-wave. Thus I think there is good chance the A=C pattern will play out with a target of 1270-1275.


Wednesday, March 23, 2011

Gold and Gold Miners

I think gold will breakout soon. No guts for gold play, but I can try miners. Both GDX and GDXJ look good.
I am long GDX with a stop at 57.8.

What's Next

Tuesday, March 1, 2011

Direction? or DIrectional Guess

Well, I got lost in direction a little bit. What really bothered me is the pull back. Today we stopped at 1320. Thatit? Damn stubborn bulls. I made couple perfectly beautiful designs for the bulls, but they dip to just 1320.


The Cobra guy talked about the “n vs n” rule:

Cobra's n vs n Rule


Where will the market go? Will it be that easy that bulls cannot take the 3 day loss? I don't think so.
The reversal at 1292 was hilarious. I have to say I need to show some respect.


I believe tomorrow we will see at least a gap fill. As usual, bulls will run a little bit further. We could see a new high this week. AND this will mark my new TOP.

Monday, February 28, 2011

my baby NFLX (2)

As I mentioned earlier, I love NFLX. I cannot live without. :D
After I closed my long term position in late 2010, I am still trading it. My feeling is just one part. I am a pretty technical person. I only trade the signals.

Today, NFLX recorded a typical pattern to yell for a short. (Well, it's actually this morning that I missed.)


Not sure what pattern to call for. Island reversal? Bearish Flag? Whatever.
The bottom line is the gap will be touched if not fully filled.

We will do the same routine to define our trading plan.
The pattern will be off for any close above 217.5.
I believe it is trigered already today by a close below 211. The only thing is Bears are in such a hurry and Bulls are not that easy to give up. Hope we can get a retest to 210 level to fill my order.
See ya in the 180s.

Thursday, February 24, 2011

Market may bounce from now

2 days! The Bear just need 2 days to eat everything above 1300. Back early January when I say Bull trap above 1310, even I don't give too much credit to my own prediction. lol

Now where are we? Broken. The daily chart is broken. The key points to watch remain the same. See my earlier post. I believe this is P3. Repeat,the P3 started.


On intraday chart, the wave structure is also easy and clear. The past days draw 2 downside channels. They both demanding a bounce. The blue scenario is going to form a head & shoulder bottom. The golden one will form a 3 push pattern. Both of them are pointing at 1325. Will they break 1325? Guess not. Check how many times this zone got hit in the past? It is a very good quality resistance now.


A lot to go. A lot to see. Since VIX is shooting up, the trader's market is coming back. Enjoy, people.

Thursday, February 17, 2011

2/17

Follow up on AKAM. So far so good. On hour chart I read a clear rejection at 43.6 level. I am kinda thinking a channel break out. Somebody says after hour should not count. Let's wait and see then.


Today I want to add 1 more chart. I mean to check out LNG for a possible rumor play. By mistake I landed on LNN. Like the chart. Another short setup? Am i bearish now? Well I don't know. :D

Tuesday, February 15, 2011

AKAM - a flag to breakout

Akamai Technologies, Inc. provides services for the delivery of content and business processes over the Internet for businesses, government agencies, and other enterprises. It offers services and solutions for content and application delivery, application performance services, on demand managed services, and business performance management services based on its technological platform, EdgePlatform.

AKAM @ Yahoo Finance | AKAM Option @ Yahoo Finance

AKAM issued earnings on 2/10 and got hammered. The daily chart explained why I bet on the low side on ER.


In the past couple days, it is crawling up, on Ericsson (ERIC) news and probably also because of Cramer's pump.
I, however, don't buy it. I see a potential bearish flag forming. The setup will become active on a breakdown below the bottom of the pattern at $41.88. If the pattern becomes active, downside potential for the pattern is to the $36.5 area, then possibly $30.

Thursday, February 10, 2011

my baby NFLX

NFLX is my baby. I found it since 2007. Use it, love it, invested in it. I closed my position late 2010 since it reached my valuation target of 200. This earning season, I estimated 2011EPS to be $4.60 and with an average multiplier of 46.6x observed for the past 3 years, I gave NFLX a target of 210-220.

Today I noted Whitney Tilson's T2 capitulated on NFLX shorts. Below are the extracts from the letter.

    In mid-December, we published a lengthy article on why Netflix was our largest bearish bet at the time. With the stock up nearly 25% since then, one might assume that we’d think it’s an even better short today, but in fact we have closed out our position because we are no longer confident that our investment thesis is correct.

    1) The company reported a very strong quarter that weakened key pillars of our investment thesis, especially as it relates to margins;

    2) We conducted a survey, completed by more than 500 Netflix subscribers, that showed significantly higher satisfaction with and usage of Netflix’s streaming service than we anticipated (the results of our survey are in Appendix A, attached); and

    3) Our article generated a great deal of feedback, including an open letter from Netflix’s CEO, Reed Hastings, some of which caused us to question a number of our assumptions.

    In summary, while we acknowledged in our December article that Netflix “offers a useful, attractivelypriced service to customers, is growing like wildfire, is very well managed, and has a strong balance sheet,” we now believe that it is an even better business than we gave it credit for. The company has enormous momentum and substantial optionality (for example, international growth), and management is executing superbly. In particular, we tip our hat to Reed Hastings, whom we had the pleasure of meeting last weekend. In addition to his success building the business and navigating the transition from DVD-by-mail to streaming media, he’s also one of the most down-to-earth, honest and straightforward CEOs we’ve ever encountered.

Based on the data provided in the T2 letter, I upgrade my target of NFLX to 235.

Monday, February 7, 2011

Key Levels to watch

The Market is rallying on below average volume and extreme sentiment. How long will it last? Bernanke may not know either.

Saturday, January 22, 2011

AMZN - broken chart

I love AMZN. I did a lot of shopping over there. In fact I even have premium membership.
However the chart of AMZN is ugly. I don't mind making some money of short it.
This is my weekly count. I believe wave 5 is concluded.


On the daily chart, it's an obvious trend changing to me.


One more chart.
I believe AMZN will touch 150-160 zone in late March or April.