5 must-see-chart stocks
IBM
LVS
BLL
MU
AMAT
I like all 5 names. I am going to post my strategies later.
Friday, November 21, 2014
Wednesday, November 12, 2014
One reliable indicator is Institutional sell
In the chart below, upper part is NYA, NY exchange index. It is the index for all stocks listed on NYSE. It is still pretty far away from all time high.
Lower part shows the trend of Institutional Selling. It is inversely related to the broad market index. When the trend lines are going down, like they have been, the declining selling activity allows the market to go up. When the trend lines are going up, like in September and October, the increasing selling drives the market down.
(chart from stocktiming)
Wednesday, November 5, 2014
re: Stock Picks From Robin Hood Investors Conference 2014
Stock Picks From Robin Hood Investors Conference 2014
I follow her on twitter because she is informative, and hot.
I follow her on twitter because she is informative, and hot.
https://twitter.com/SallyPancakes/
David Einhorn (Greenlight Capital): long SunEdison (SUNE), Greek banks like Alpha and Piraeus (via warrants). Short French debt.
David Tepper (Appaloosa Management): short the Euro.
Larry Robbins (Glenview Capital): long Community Health (CYH), Realogy (RLGY), VCA (WOOF), Fidelity National Financial (FNF)
Dan Loeb (Third Point): long Amgen (AMGN) and has talked to management
Paul Tudor Jones (Tudor Investment Corp): Thinks commodities will be a mess until 2020, likes US stocks.
Jim Chanos (Kynikos Associates): Short Petrobras
Scott Ferguson (Sachem Head): Long Comcast (CMCSA). He previously worked at Ackman's Pershing Square.
Keith Meister (Corvex Capital): Long Crown Castle International (CCI), also long Allergan (AGN).
Zach Schreiber (PointState Capital): ex-Duquesne guy, used to work with Stan Druckenmiller. Long Cheniere Energy (LNG).
Nehal Chopra (Tiger Ratan Capital): long Charter Communications (CHTR)
Fred Wilson (Union Square Ventures): Venture Capital, not equities but insinuated he'd be short Netflix (NFLX), Amazon (AMZN), and eBay (EBAY).
Tom Wagner (Knighthead Capital): long American Airlines (AAL)
Matthew Sidman (Three Bays Capital): long Churchill Downs (CHDN)
Ricky Sandler (Eminence Capital): long Telefonica Brasil (VIV) and eBay (EBAY)
Traci Lerner (Chesapeake Partners): long American Airlines (AAL), Gencorp (GY) and Eagle Materials (EXP)
Whitney Tilson (Kase Capital): long Sodastream (SODA) and Micron (MU). Short Lumber Liquidators (LL) and Exact Sciences (EXAS)
Ivy Zelman (Zelman Associates): long homebuilders, Lennar (LEN), Pulte (PHM), Toll (TOL), as well as Fortune Home & Security (FBHS) and Mohawk (MHK).
Bill Eigen (JPMorgan): Short bonds to play volatility
Nathaniel August (Mangrove Partners): Short Worldwide Wrestling Entertainment (WWE), long Fortress Investment Group (FIG)
Oleg Nodelman (EcoR1 Capital): long Clovis (CLVS)
Amish Mehta (SQN Investors): long Blucora (BCOR)
re: Sohn Conference San Francisco 2014 Notes
found online
Sohn Conference San Francisco 2014 Notes
Jeff Ubben - ValueAct Capital - LONG Agrium (AGU) Thesis: They have a $750M stake in the company. Generally sees opportunity in the space. AGU has continued to invest in the business the past 7 years, thinks this investment will start to show returns. JANA went after mgmt and lost proxy battle, but this still lead to change in mgmt. They agreed with Jana. AGU's retail business is the jewel of the company. Wholesale business is volatile. AGU has put $7.6B into capex since 2012. $1.7B should start to get returned to stockholders starting in 2016 or 2017. Sees a share price of $120 to $150 a share.
Key reasons for liking AGU:
1) New CEO has a more focused game plan;
2) Strong growth in FCF despite down cycle;
3) Cheap any way you look at it;
4) Well positioned in consolidating market. Thinks this is a good investment that offers potential returns of 20% a year for a few years.
Kurt Billick - Bocage Capital - LONG Lundin Mng (LUNMF) Thesis: Has a commodity focus. For a while, China had been the key driver in increased commodity demand. The lack of investment in infrastructure up to that point, lead to a steep climb in prices, which in turn lead to more capital and investment. Nickel and Zinc are seeing excess inventories absorbed. Copper is even more interesting. Likes mining companies that mine base metals and LUNMF mines Nickel, Zinc and Copper.
Mick McGuire - Marcato Capital Management - LONG Packaging Corp of America (PKG) Thesis: Started his presentation out by noting that his pick from last year Sotheby's (BID) is down since he presented, and he likes it even more than he did last year. With respect to PKG, it has a market cap of roughly $7B and they own roughly 3% of that. Favorable trend for companies in this space as there has been consolidation leading to pricing power. There's also an opportunity for part of the business that processes virgin wood pulp to become an MLP. Sees possible price of $122 or 77% upside compared a price of roughly $70 at the time of the presentation.
Brian Zied - Charter Bridge Capital - LONG CaesarStone (CSTE) Thesis: Likes to focus on industries driven by evolving consumer landscape. CSTE's product is engineered quartz surfaces for kitchen countertops, bathrooms, floors and walls. Quartz is gaining share vs. granite and marble. Quartz has similar aesthetic, but superior performance. Better characteristics include: scratch and heat resistant, non-porous, identical slabs, lifetime warranty. Quartz is less expensive too. Kitchens have become a larger part of the American home over time and are now a focal point of the home compared to say the 50s or 60s. Remodels now usually also focus on kitchens first. Quartz is gaining share relative to granite and marble. CSTE is the only branded luxury quartz countertop maker. EBIT margin and ROE are much higher than peers. Compound sales growth over the last two years has been 45%. Sees a possible stock price of $97 based on eventual EPS of $6.50 and a PE multiple of 15.
Carl Kawaja - Capital Research Company - LONG Zulily (ZU) Thesis: Internet retailer that is largely unpopular right now with large short interest. IPO in November of 2013. Most people in the audience at Sohn in SF are men, and men don't get ZU. ZU vs AMZN, about half of items on ZU are not on AMZN. Site is customized and successful. ZU offers merchants better terms on their site. Potential market is big. Typical customer spends $150 in first year, but if they stay, they eventually avg $500 a year. Reminds him of Costco. Bear arguments include: slow ship time, shipping charges not sustainable, and kid sales are dropping. By 2018 he sees a potential market value of $11B compared to a bit over $4B right now.
Sandy Colen - Apex Capital - LONG Container Store (TCS) Thesis: Likes big opportunities that can be held for a long time. TCS is down 60% YTD. IPO'd at 18 and went to the 40s and is now at 17. Some see weak traffic. Keys to success include: grow store base, branded closet line, controlled spending, improve operating leverage. Sees potential EPS of $1.40 in 2017 and $8.50 in 2025 compared to analyst consensus of $1.00 for 2017.
Mick Hellman - HMI Capital - LONG LPL Financial (LPLA) Thesis: In money management there are two key groups, the manufacturers and the distributors. LPL is in distribution. Has over 14,000 advisors with $465B in Assets Under Control. Stock is down a lot recently, but believes problems are solvable. 90% return on tangible capital. Tailwinds include: large recurring opportunity, more need for financial advice, mix to fee based, client money tends to stay on platform. Chokepoints include: best platform, compliance and practice mgmt, scale play, stickiness of platform, flexible product platform. Sees opportunity for low 20% annual returns.
Scott Fearon - Crown Capital Management - LONG Grand Canyon Education (LOPE) Thesis: Owns 115,000 shares of LOPE. Focus is companies less than a couple billion in market cap. Lots of money managers don't understand LOPE. Of the for profits, LOPE is the only one up since 1/3/2012. Revenues have also been growing. There is a large short interest in the stock. There are 11,000 students in the physical school and another 53,000 online. Four positives about LOPE include: ground campus, affordable, christian, relevant degrees. Outside possibility of turning dorms into REIT. Admission standards are high. Low default rates on student loans on par or better than traditional nonprofit colleges. Potential for $12 in EPS in 10 years with a 15 PE implies a price potential of $180.
Meridee Moore - Watershed Asset Management - LONG W.R. Grace (GRA) Thesis: This was also her stock pick in 2011. Feels like October 2011 again. All chemical companies are down, but GRA is different kind of chemical company. Three main lines: Catalyst Technologies, Materials Technologies, Construction Products. Focus is on ROIC. Stock is at $89 now. Was roughly at $39 when she recommended it in Oct. of 2011. GRA emerged from Chapter 11 in February of 2014. Stock could be up 37% a year from now based on peer value of EBITDA. Risks: global slowdown, high rare earths prices, strong dollar, delaying in construction infrastructure spending, recent declines in oil if sustained could mean low prices for Catalyst Technologies.
Jose Medeiros - Stonerise Capital Partners - LONG QVC (QVCA) Thesis: Likes to have concentrated portfolio of 6 to 8 long investments a year. QVC is value hiding in plain sight. Digital retail. High retention rates with spend per customer going up. Attractive financial model and 8% FCF yield. Was buried in LINTA before, but now trading. Not much analyst coverage yet. Trades at $25 with potential for a price of roughly $42 in 2016. Second Pick: LONG Global Eagle (ENT) Thesis: In flight entertainment and connectivity is a growing market and ENT is a leader. Has 150+ airline customers. Deals with airlines are recurring and have long term contracts of 7 - 10 years. Air traffic is doubling every 15 years and connectivity is growing even faster. Penetration and take rates are low now. Gogo, a competitor, is based on ground to air. Doesn't work over water and other issues as well as that. Satellite based better. Market cap of $800M. Is down more than 40% in the last 12 months. Has a strong balance sheet. Other potential catalysts like Dish sponsorship deal.
Jeff Osher - Harvest Small Cap Partners - LONG Green Dot (GDOT) Thesis: They own over $50M of stock. Sees at least 88% upside over 6 to 12 months as concerns get addressed. Growth is reaccelerating. 30% of cap is cash. Has a $1.1B market cap. TAM is 160M customers (17M unbanked, 51M underbanked, 90M unhappily banked). Simple financial model, sales come from: sale of cards, transfers / reloads, interchange. Amex entry into market scared investors, but Amex not doing well with prepaid cards. Misconceptions include: concerns about collapsing margins, structural growth issues, loss of WMT will destroy GDOT.
LMP Nov 2014
Me is back. October is a month that made its spot in trading history.
- Sharp reversal. This October could be 1st time since March 2009 when S&P 500 fell by >7% only to end the month positive.
- Volatility event. VIX is the volatility index measuring the fear level of the market.
VIX is a trademarked ticker symbol for the Chicago Board Options Exchange Market Volatility Index, a popular measure of the implied volatility of S&P 500 indexoptions. Often referred to as the fear index or the fear gauge, it represents one measure of the market's expectation of stock market volatility over the next 30 day period.
Since the first availability of VIX data in 1990, the VIX has only jumped 74% during a 5-day period on a handful of occasions: 1994 (surprise Fed rate hike); 2007 (Shanghai market crash); 2010 (euro zone crisis); and 2011 (more euro zone crisis.) In other words, the past month was nearly unprecedented and exceeds the 2008 financial crisis, the dotcom crash, LTCM, etc. in terms of the magnitude of the VIX spike.
Since we are using the month end signal for portfolio maintenance, it has no big change.
- SP 500 (Risk ON)
- MSCI EAFE (The Most Famous International Index) (Risk off)
- U.S. 10-Year Government Bonds (Risk ON)
- NAREIT (U.S. Real Estate Index) (Risk ON)
- SP GSCI (Goldman Sachs Commodity Index) (Risk off) / GLD (Risk off)
- US Dollars / UUP (Risk ON)
In the charts below, the lighter color Moving Average is 200 Day, which is very close to the IVY Portfolio setup.
Friday, June 6, 2014
Tuesday, June 3, 2014
Bet into earnings
I want to show another way of using options. Earnings release is a typical event trading topic. Every company has to release earnings 4 times in a year. At ER, company is going to summarize previous quarter and provide forward looking statement. Frequently it becomes a catalyst to stock price movement.
Stock selection
Graham Valuation Model
Benjamin Graham is a legendary stock writer from last century. Overall, Graham taught us the philosophy behind valuing a company and investing, while Buffett has shown an example of how to apply Graham’s knowledge and has taught us how to be more critical of management.
- Fundamental analysis
By using the info provided by the above website, I selected this stock JOY.
From google:
Joy Global Inc. manufactures and services mining equipment for the extraction of coal, copper, iron ore, oil sands, gold, and other minerals.
- Sector analysis
In general, the entire mining machinery sector is going to be benefit from the improving China PMI.
China’s slight improvement in their main manufacturing PMI to 50.8 from 50.4 for May just puts it back to its 2013 average of 50.8 but as we all fear a pronounced China slowdown, the markets are taking the news positively. Export orders and employment remained below 50 but new orders rose to a 6 month high. China has taken some modest stimulus steps and are now afraid of slowing the property market too much as housing restrictions have been eased and selective reserve requirement ratios have been lowered. China’s markets were closed overnight but copper is up by almost 1.5%.JOY as one of the most shorted stock could be Primed for a Short Squeeze
- Technical analysis
Here is the link showing the TA of the stock.
- Analyst opinion
Zack is an analyst site I follow. They think the earning could be great.Option Combo
I opened a calendar spread. That is short Jun 60 call and long July 60 call. I need the stock to go up but not too much. My sweet spot is 60.
Monday, June 2, 2014
LMP June 2014
The 5 portfolio components signals are
In the charts below, the lighter color Moving Average is 200 Day, which is very close to the IVY Portfolio setup.


- SP 500 (Risk ON)
- MSCI EAFE (The Most Famous International Index) (Risk ON)
- U.S. 10-Year Government Bonds (Risk ON)
- NAREIT (U.S. Real Estate Index) (Risk ON)
- SP GSCI (Goldman Sachs Commodity Index) (Risk ON) / GLD (Risk off)
- US Dollars / UUP (Risk off)
In the charts below, the lighter color Moving Average is 200 Day, which is very close to the IVY Portfolio setup.
This month I really have nothing to talk about. I posted my
charts in twitter such as this one. No change to my view.
I have limited exposure at this moment. I use covered calls
to hedge my long position. I discussed this topic couple times. Refer to my
covered call page for details.
I also sold puts related to VIX products. Any spike in VIX
will be time for me harvest.
Saturday, May 3, 2014
weekend for fun
| AMATEURS | PROFESSIONALS |
| Have tons of ideas, are excited about all of them and see none to fruition. | Have tons of ideas, pick one and do their best to make it happen. |
| Think they can do everything. | Know it’s almost impossible to achieve one thing. |
| Think they know everything. | Are always learning. |
| Start with no preparation. | Do research, they want to know where the bodies are buried, what the landscape holds. Better to take all these factors into account before you start, because trying to adjust on the fly is so much more difficult, it wastes time and energy and it’s hard to put a fourth wheel on a car you designed with three. |
| Don’t finish. | Are all about execution. Sure, they occasionally abandon a project when they see further effort is fruitless, but the mark of a pro is someone who begins and ends. If you notice someone can’t complete a task, run from them! |
| Are worried about image. | Let their work do the talking. |
| Demonstrate insecurity. | Are extremely confident. |
| Can only see what’s in front of them. | Are all about the big picture. |
| Hold those above them in contempt. | Hold no one in contempt, but they haven’t got much time for losers. If you’re an amateur trying to graduate to professional status and you have the good fortune to encounter a pro, DON’T WASTE THEIR TIME! Give just one or two compliments and ask your question. But most amateurs are so busy being sycophants the professional tunes out, or goes on at such length that the professional excuses himself. |
| Have no idea what dues are. | Have paid their dues, and are still paying them. |
| Believe in instant success. | Know anything worth accomplishing takes a long time, and what might look like overnight success is rarely such. |
| Boast. | Never slap their own backs, and are oftentimes uncomfortable with others slapping their backs. |
| Get nervous. | May be anxious, but they’ve performed the task so many times they let instinct take over, they go on their experience, nervousness never comes into the equation. |
| Are looking for their one big break. | Know that life is about a series of breaks. |
| Are afraid to fail. | Don’t like to fail, but when they do they pick themselves up, dust themselves off and get back in the game. |
| Interrupt. | Listen. |
| Demonstrate their bile, they get frustrated or angry and it’s easy to see. | Are cool, calm and collected. You may read about the crazy owner/operator/entrepreneur, but if they’re truly nuts, they don’t last, their board replaces them, and the truth is most are not that nuts, it just makes a better story in the press to portray them as such. |
| Bristle. | Show empathy. |
| Are always telling you how busy they are and how hard they’re working. | Show up and stay as long as it’s interesting and profitable, bitching gains them nothing, so they don’t. |
| Believe what people say. | Believe what people do. |
Thursday, May 1, 2014


Wednesday, April 23, 2014
reading list
This is the mid-of month catch all. I will put ideas, readings and charts together here.
The pattern itself has a pretty big range. I marked 3 possible areas for pull back target. I am going to trade the range 1810-1875 (or 1800-1900 to be safe) for now. Again this is not a long term sell signal yet. If you really want to know what I do, pm me for discussion.


While stocks are prone to boom and bust cycles, experts say a well balanced portfolio is the best way to grow wealth over a long period of time."Investing over period of years in diverse portfolio is the pathway to financial stability,"
Tape reading
This is a chart I cut this morning. I read it as a bearish crab. In other words, unless we get some super power to take out the previous all-time high 1892.75, it will check the gravity. Recently with the momentum stock sell-off, new tech, bio, solar, and other hot names are all coming back from peak. Before the market finds new motion, I really cannot see a new high.The pattern itself has a pretty big range. I marked 3 possible areas for pull back target. I am going to trade the range 1810-1875 (or 1800-1900 to be safe) for now. Again this is not a long term sell signal yet. If you really want to know what I do, pm me for discussion.
Interesting Stats
I found this from bespoke.com
From this table, we can see Tuesday is really bullish. Actually this table starts from this year. Per my count, Of the 17 Tuesdays since Dec 24th 15 have been up and only 2 down. Also Tuesdays account for 8.68% which is also impressive. Tuesday and Thursday are positive, the other 3 are on average negative. Go figure.
Goldman's forecast
With all of that in mind, here are Goldman Sachs' current forecasts for
the U.S. economy and every major financial asset class in the world. It
comes from David Kostin's new US Weekly Kickstart note.
Other readings
In spite of these challenges, investment strategies have tried to benefit from such inefficiencies. The two most common approaches investors have used are to wager that the macro inefficiency will continue to magnify or that it will revert. The first is a momentum or trend-following exposure while the latter is a contrarian or reversion exposure. As mentioned earlier, both these approaches need patience, ample reserves and nerves of steel.
Americans still don't trust the stock market
The survey of over 1,000 households by Bankrate.com showed that 73% are "not more inclined to invest in stocks.While stocks are prone to boom and bust cycles, experts say a well balanced portfolio is the best way to grow wealth over a long period of time."Investing over period of years in diverse portfolio is the pathway to financial stability,"
THE “STOCK PICKER’S MARKET” FALLACY
Overall, most investors would do well to ignore the allure of “stock picking” and any notion that they have an innate ability to pick winning stocks. I know this may be hard to accept but it should be somewhat easier when you look at the performance of most institutional stock pickers who suffer from the same behavioral foibles. This is not to say that it is impossible pick winning stocks as there are certainly great stock pickers in existence. However, the casual investor with no process or strategy is highly unlikely to be among them. It is never a “stock picker’s market” for these investors.
Fortunately, though, stock picking is not a prerequisite to successful investing. In fact, it is the antithesis of successful investing for many. For most investors, instead of “doing their homework” in trying to find the next Google or Apple, they should be developing an appropriate asset allocation plan and sticking to it. While not as exciting as jumping aboard the latest 3D printing or biotech breakout, it is likely to be significantly more profitable in the long run.
Monday, April 7, 2014
bottoming or not
Today ES, the SP500 futures draw a quick bottom around 1833 which happened to be 3/27 low. So far I believe it is bottomed for now. IMO, it is a good quality 1on1, pointing at high 1850s. On the chart I listed couple supporting levels.


The next chart is silver daily. As I mentioned last time, I am playing the Gartley reversal. My target is still 21.50
Thursday, April 3, 2014
LMP March 2014
The 5 portfolio components signals are
In the charts below, the lighter color Moving Average is 200 Day, which is very close to the IVY Portfolio setup. This month is trick as couple charts need further consideration.
- SP 500 (Risk ON)
- MSCI EAFE (The Most Famous International Index) (Risk ON)
- U.S. 10-Year Government Bonds (Risk off)
- NAREIT (U.S. Real Estate Index) (Risk ON)
- SP GSCI (Goldman Sachs Commodity Index) (Risk ON) / GLD (Risk off)
- US Dollars / UUP (Risk off)
In the charts below, the lighter color Moving Average is 200 Day, which is very close to the IVY Portfolio setup. This month is trick as couple charts need further consideration.
1. SPY
I truly believe 2014 will be a stock picker's market. Overall economy will recover and getting better. Overall stock market performance will not be as crazy as last year. Again, it is time to forget Beta and searching for Alpha. As a result, I will still looking for individual stocks to invest, rather than park in SPY, the SP500 ETF. I will post a chart of my view on SPY/SPX/ES later. Basically I think there is a small correction due right in front of the historic high on ES. Job report this Friday could be a trigger for that.
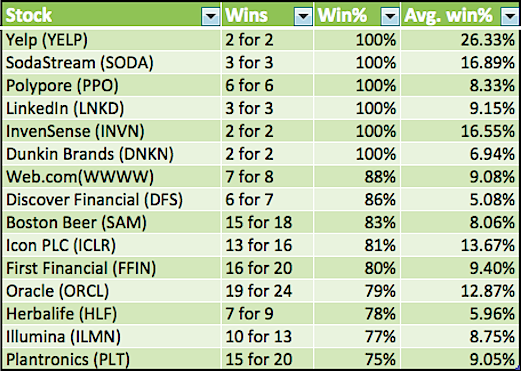
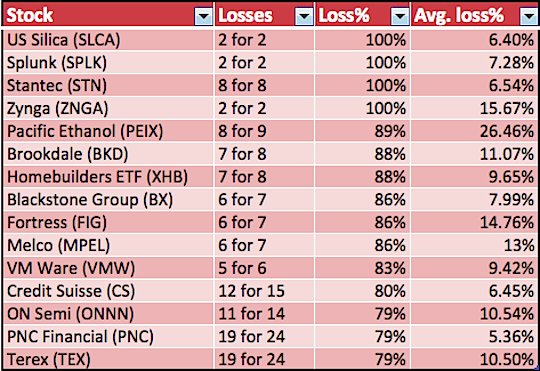
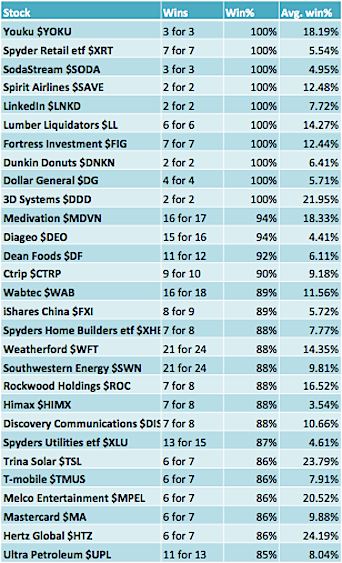
According to STA, April is the best month for equities. Here is a review of March sectors:
Here is a list of stocks showing strong seasonality in April.
A couple of items worth noting: Energy names Weatherford (WFT) and Southwestern (SWN) have produced positive gains in 21 out of 24 occurrences in the month of April. The average win% for Weatherford has been 14.35% and 9.81% for Southwestern – now that’s some strong April seasonality! As well, the Retail Index (XRT) has not had a losing April in its young history (7 ofr 7).
Here is the link
2. DEM / EEM
The crisis in Ukraine continues to be fought on the diplomatic and public relations fronts. Russia
continues to station 40,000 troops on the Ukranian border. Meanwhile, Russian Foreign Minister
Sergey Lavrov is on record as saying, “We have absolutely no intention of, or interest in, crossing
Ukraine’s borders.”
Emerging market is recovering and just took the 200MA as I mentioned in my last post. I went in using option combos on EEM. The trend change is largely led by Turkey and Brasil. I am looking for stocks too. Below is a list of countries I like and the ETF ticker:
Vietnam (VNM), Thailand (THD), Indonesia (EIDO),
Turkey (TUR), Poland (EPOL),
Brazil (EWZ), Colombia (GXG) and Mexico (EWW).
I also think frontier markets (FM) continue to make sense, particularly for those seeking portfolio diversification. Another attractive way to play emerging markets is with the bonds; the most liquid of which are the PCY and EMB ETFs.
3. TLT
I'm out of bonds for couple months. Even though it is now very close to buy signal, I decide not to take it. I park my money at some "bond" like equities, such as Private Equity and Mortgage Servicer and Insurance Companies. Another alternative can be municipal funds. I need time to explore that area.
4. Real Estate
No major change other than I moved some capital into some stocks such as builders and investors.
5. Commodity
Still risk on, but the price action is weakened by strong dollar. Not sure how long it will be. I am in favor of energy and agricultural stocks. I also think gold miners may get a chance. I will post my charts later.
I continue to favor long positions in corn (CORN) and agriculture (DBA). I also like being short crude oil (USO) and continue to favor a short position in natural gas (UNG).
Wednesday, March 26, 2014
quick update - EEM SLV
The world is uneasy in the past couple weeks. The market is volatile. My view is "the short term market is weak but not enough to trigger mid- to long- term sell."
EEM is the ETF for emerging market. After the Ukraine crisis cool off a little, it is rebounding. I see a good year for the emerging market. I expect high 41s in short term.

SLV is the ETF for silver. I have been trading silver for couple months. I have a neutral position at this moment because there are lots of uncertainties in the metal market. It is OK to say IDK from time to time. I am Long term bullish. I modify my position when a buy is triggered which could be very soon.

Tuesday, February 18, 2014
reduce exposure
V shape again. No matter how much I love it, I feel ES / SPX is getting close to a stopping point. I reduced my exposure today. Overall my target is still 1880. I want to buy at 1815. There is chance ES break out 1850 directly w/o correction. If it happens, I will chase.

Friday, February 7, 2014


Monday, February 3, 2014
New Year, January Barometer, and so on
Portfolio Update
Oops I guess I missed yet another update. No change in signal for Jan, even with the sell off in the new year. As i described, my style of Ivy Portfolio is to adjust at the month end only, so even with today's crash, sell is not triggered yet.
Market View

On Jan 29, I posted the chart above. It is Daily chart of ES, which is the futures of S&P 500 index. We got a confusing signal in the new year. SPX made a new high, while ES didn't. My best explanation is the new high is not decisive. I still should read the chart as triple top. The headache is however lots of indicators give totally different reading. That's why I said I am not sure if bottom is in at 1780 and pointed out 1730 is a better support.

Here is the chart for today. Very unfortunately we are at 1730s now. It is very oversold at this moment. VIX spiked today. I think it could be a good bottom for this wave. I am guessing an upward correction to north of 1800, then form the next trend. I am going to update my VIX chart in a moment. If you hedge your portfolio using my vix>14 rule, you should book nice profit. I am unwinding this leg now.
January Barometer
Definition:
I checked recent years and I don't think I can get a clean statistical conclusion. I think in a bull market the bullish JB setup performed way better. (90%ish per STA.) In a bear market, the result is way more indecisive. If we look at bearish setup only, JB delivers a useless result, 52%. The most recent bearish JB signal happened in 2008, 2009 and 2010. It was only correct in 2008 and was miserable in 09 and 10. The only before that is 2003. It was bad again. My take is JB is good for trend following in bull market, but not that useful in trend change or bear market.
TBC
Oops I guess I missed yet another update. No change in signal for Jan, even with the sell off in the new year. As i described, my style of Ivy Portfolio is to adjust at the month end only, so even with today's crash, sell is not triggered yet.
Market View
On Jan 29, I posted the chart above. It is Daily chart of ES, which is the futures of S&P 500 index. We got a confusing signal in the new year. SPX made a new high, while ES didn't. My best explanation is the new high is not decisive. I still should read the chart as triple top. The headache is however lots of indicators give totally different reading. That's why I said I am not sure if bottom is in at 1780 and pointed out 1730 is a better support.
Here is the chart for today. Very unfortunately we are at 1730s now. It is very oversold at this moment. VIX spiked today. I think it could be a good bottom for this wave. I am guessing an upward correction to north of 1800, then form the next trend. I am going to update my VIX chart in a moment. If you hedge your portfolio using my vix>14 rule, you should book nice profit. I am unwinding this leg now.
January Barometer
Definition:
Devised by Yale Hirsch in 1972 our January Barometer (JB) states that as the S&P 500 goes in January, so goes the year. The indicator has registered only seven major errors since 1950 (all within secular bear markets) for an 89.1% accuracy ratio.Market Talks:
Ye Olde JB is negative. On top of this, DJIA closed below its December closing low of 15,739.43 on January 29. Both are ominous for this nearly 5-year-old bull market. Since 1950, this combination has occurred 21 times with declines going on to average –14.0%. Full-year performance was negative 14 times with all 21 years posting an average loss of –3.2%.
My Observation:
I checked recent years and I don't think I can get a clean statistical conclusion. I think in a bull market the bullish JB setup performed way better. (90%ish per STA.) In a bear market, the result is way more indecisive. If we look at bearish setup only, JB delivers a useless result, 52%. The most recent bearish JB signal happened in 2008, 2009 and 2010. It was only correct in 2008 and was miserable in 09 and 10. The only before that is 2003. It was bad again. My take is JB is good for trend following in bull market, but not that useful in trend change or bear market.
TBC
Subscribe to:
Comments (Atom)