Wednesday, January 25, 2012

Market view from 2 big names

I thought I posted this earlier. Below are 2 interview clips from Bloomberg. Both of them called for top.

DeMark, in my opinion, is the most important market timer, and has the most influence to my trading style. In summary, in the 1/20 Friday after close interview, DeMark called for peak out on Tuesday 1/24. He predicted 1338-1342 was not happening. He also said VIX exhausted and would reverse in 1-2 days.


Joe Granville is also a big name.
According to Shiller (the big name created the Shiller Index), the biggest one day rally in 1980 was purely due to the entire market was following Granville's call. He called for 2 years of bull market in late 2009. According to the Bloomberg video showed, he is the Market Timer of the year 2011. I believe it is not his first time.
He took an interview on 1/23 Monday and said Friday was top and predicted the drop speed to be 1000 Dow points each quarter for 2012 and predicted 8000 in Dow. I didn't realize Granville is 89. Keep going Joe.

Monday, January 23, 2012

An interesting view on 401K management

I found this PDF online. The author is a manager on 401K plans. He made couple interesting points in his newsletter "A Technical Review Of The Markets"

For those of you with busy schedule, here are some highlights.

As you can tell there are no areas currently in the market that are screaming “BUY ME” currently. This is because the markets have gotten a bit too far ahead of themselves and a correction is imminent.
 We continue to highly recommend that you wait to add exposure or rebalance to the model until the market either corrects or consolidates its recent moves.
He did touch couple interesting points, such as how to manage future contribution, which could be very different than current holding. He also hit allocation within the same asset class, re equity.
Current 401k Allocation Model
15% Cash + Future Contributions
These options include:
Stable Value, Money Market, Retirement Reserves
35% Fixed Income
Bond funds are a play on the direction of interest rates
Short Duration, Total Return & Real Return Funds
50% Equity
The majority of funds track their respective index.
Therefore, select ONE fund for each category. Keep it
simple.
30% Equity Income/Balanced/Growth & Income
20% Large Cap Value
0% International Value
___________________________________
ALL NEW MONEY (Monthly Contributions)
100%Cash Option
Overall his understanding of market is pretty close to mine, for example, Risk = Loss, Managed Risk = Returns.
Total Return Investing
We believe that portfolio should be designed for more than just capital appreciation. There are times when markets do not rise.
I believe he is talking about the past decade. If the market is not moving, then you'd better do something to avoid losing money.

Happy Chinese New Year

I am super adaptive (and I put it in my resume). I celebrate all holidays of all regions and all religions. (Yeah, why not.) Today is the big one, the lunar new year or Chinese New Year. According to Chinese tradition, people give Red Envelops to symbolize good luck and ward off evil spirits. Here is a small one from me. Wish you a great new year.

i did some quick coding in TOS based on an article from Connie Brown. In general it is one of a series of practices to apply moving average and macd to RSI. Like RSI and derivatives, it is easy to apply. Extreme reversal, zero line breach, divergence. Be aware, this is just the very first version. it may contain mistakes and/or misunderstanding. By no means it can serve as a sole indicator for trading. I am not responsible for any consequence or coincidence.

The code: See comments area.

How to use it: A daytrading program's week (hypothetical) using DivG indicator on 15 min ES.


(click to enlarge) 

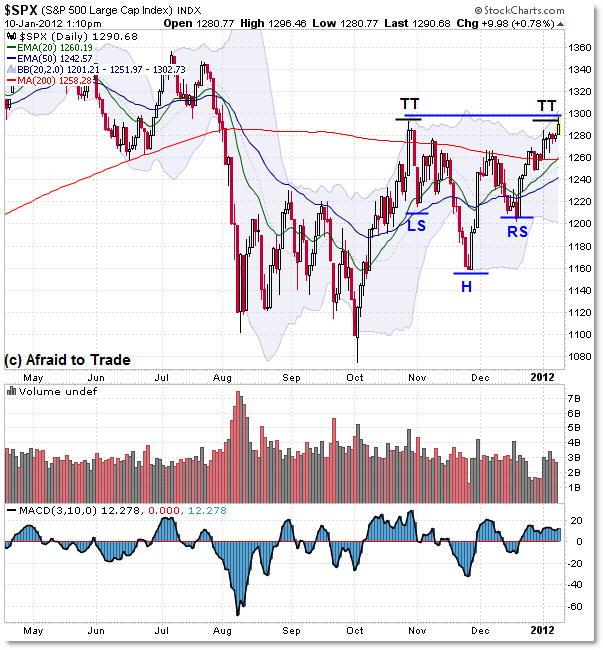
Easy Tuesday: Woke up in the morning and realized price trend down, RSI down, DivG convergent with the trend. So the plan is to short the pop until I see a trend change.

12:15 ES rebounced and rejected at MA. DivG make a peak then reversing, RSI made a small pull back then resumed down trend. Short at 1296.
3:15 ES made a new low at 1286, but DivG formed a divergence. RSI traveled to oversold territory then pull back. It's time to cover. (+10 points)

Strong Wednesday: Overnight, ES formed a double bottom at 1286, which was also Tuesday low. DivG and RSI both made a higher low, or divergence. The plan is to long on pull back. 9:50 ES took the MA. Long at 1292. After a small pull back to 1294, ES printed 1301. DivG didn't follow and formed a div, while RSI was rejected at 70 line. Set a stop at previous swing high 1298. Stopped out 1:30. After that, price and oscillators kept on making new divergence. Not sure what it is and I choose not to look at it. (+6)

Sit on hand Thursday: correction finished overnight and market was super strong after good econ news. It was a confusing day. Not only I was confused, but the entire market. Pull back never closed below MA. Osc never gave signal. RSI and DivG, which is a derivative of RSI disagreed in the afternoon. Why bother trading, sit on hand is the best choice. (0)

Friday is January Option Expiration day. It was a boring day and I should not trade. But after a boring Thursday I could not help myself. At 11:30 ES dip to overnight low of 1305 and found support. DivG made a positive divergence. RSI made a reversal in the green box. The range was small that day. I never got chance to get out. 2:30 ES made a higher low at 1306 with another divergence on DivG. Add 2nd batch. It turned out to be good. Closed at 1311 before close.(+6, +5)

DivG actually suggested holding short over weekend, since it could not make new high with the price, but it is against the rule.

Sunday, January 15, 2012

LMP - on Real Estate

I am monitoring the NAREIT Index and ETF all the time. Except November it was always on the sell side. See the discussion here.
Marc Faber said RE in America is cheap, relatively compared to other asset classes (link here). I feel the same way, but why I never get a buy signal? After revisit the data, I realized I made a mistake.  By law REITs are supposed to pay out large portion of income. Here is an example.

Avalon Bay, a DC based luxury apartment community, has elected to be taxed as a real estate investment trust and would not be subject to federal corporate income taxes if it distributes at least 90% of its taxable income to its stockholders.
I forgot the dividend. When reviewing the charts, I should have used the adjusted close price, but not the close price which is pure cash and ignored the accrued dividend.

Here is the revisiting of the REIT ETF REZ I used as proxy.

(insert chart)

Using adjusted close, it was actually closed right at the 10-Month MA in Oct and above that since the Nov bar. Action I am going to add REZ to my portfolio based on chart reading in the next couple weeks.

Wednesday, January 11, 2012

A chart from Corey Rosenbloom

Afraid To Trade - By Corey Rosenbloom

In the chart, Corey laid out the dilemma we have for now. Is it a “Double Top” reversal pattern or an “Inverse Head and Shoulders” continuation pattern?


I am on the reversal side. As I mentioned on 1/5, I think the market is in the last leg up to 1300-1320 area, followed by a massive crash down. The round number 1300 is really critical. Anything above this level could trigger short cover or "trying to be smart" buy orders. If rejected here, the double top pattern will send us to at least 1240-1250 area immediately. A lot of EW guys have already claimed wave 3 down started, such as Sqwii Trader:

Prechter of EWI disclosed he opened a big short position with stop at 1360.

I trade what I see, but not what I believe. I don't have deep pocket and I am risk averse. I will sit on hand for now. If things changed in the next couple days, I will change my portfolio accordingly.

Monday, January 9, 2012

waiting for wave 3

I am not an Elliott Wave guy. I don't trade waves. BUT this time it is different. I check Daneric's wave count everyday. I read EWI's email everyday. Why? Because I strongly feel something wrong.

Here is a chart I find on ZH this morning. It perfectly illustrates what's in my mind.


In the 2 tinted boxes, I see the similarity. Market does not have memory but historically price patterns tend to repeat themselves. In coincidence (or not), the price behavior can be labeled as Wave 1 and 2 that meets Elliott Wave Principle perfectly. Wave 3 usually is the longest and most powerful one in the 5+3 structure of EW. If it played out, or the history in 2007 repeated, we would see blood in the street.

Not sure if it will play out. Not sure if it will happen. But I don't feel comfortable buying equity at this moment. As I mentioned, I am currently holding 20% Gld (Gold), 20% UUP (US Dollar) and 60% Bond products.


ADD:
Here is a research report from Goldman Sachs. I will read it in detail and revisit my gold investment later.
2012 - a Gold Oddysey

Friday, January 6, 2012

Job data good, but...

From the headline:

NFP Payrolls At 200K, Expected At 155K; Unemployment Rate Drops To 8.5%, Labor Force Participation At Lowest Since 1984


Zerohedge reports based on MS data:

Enamored with the 200,000 number? Don't be - the reason why the market has basically yawned at this BLS data is that as Morgan Stanley's David Greenlaw reports, 42,000 of the 200,000 is basically a seasonal quirk, which will be given back next month, meaning the true adjusted number is 158,000, essentially right on top of the expectation. From David Greenlaw: "some of the strength in this report should be discounted because of an seasonal quirk in the courier category of payrolls (Fed-ex, UPS, etc).  Jobs in this sector jumped 42,000 in December, repeating a pattern seen in 2009 and 2010 (see attached figure).  We should see a payback in next month's report."

The stock market is hitting high 1 more time and drop quickly. I guess it is due to Europe data. If it cannot recover in short term, the double head pattern will be in effect.

add: I saw Daneric's  post from last night. It is a very good analysis based on Elliott Wave. In all 3 possible counts, he made the same conclusion that the rally is coming to an end.
All in all, I am pretty bearish considering the wave pattern is complete or almost complete. Sentiment is more than ample bullish, in fact its almost scary bullish considering credit lockup(s) occurring in Europe. Technicals seem to be waning and diverging.  And there are a lot of non-confirmations.
I still think when exiting, the smart money may push the market a little bit higher, but I agree with him that 2012 could be ugly.

Thursday, January 5, 2012

Short term view

New year, new plans. On 12/28 I wrote:
With a serious oversold condition and thin volume, this market has not much room to go down. My best guess is we are heading toward another bumpy trading range. We may see some higher highs, then collapse in new year.
We did took out the 12/27 high around 1270. We are challenging the 6 month high which is SPX 1285-1290 area from Oct. 27 and 28. The market is overbought and is losing upside momentum in to today. Today's tape is interesting, dip lower then rally back. As a typical conspiracy believer, I think it is "smart money" trying to front run the job data tomorrow. Since smart money is always smart and never go wrong, I guess the job data must be good. I guess the market will break out and challenge 1300-1320 area. I will refine my target based on tape reading later.


Add charts.


One thing to note, Gold is recovering and actually gained more today than equity. Gartman also turned bullish on it. Refer to some "Gartman followers" here. This is another warning sign. Why big guys buying gold?

I take if the job data bad, we will have a double top at 1290 and trigger a wave 3 sell off immediately. I also think we will have QE3 this year, after a brutal blood bath.