Friday, August 30, 2013

8/30 Update: Support, Resistance, and Volatility

Update to an old chart.


I still have long positions. I don't feel right at this moment. I am thinking of unwinding.


Wednesday, August 28, 2013

settling down after a 9:1 day

So far I read a Double Bottom in at ES 1625 area.
So far this pull back from 1670 is unexpected but quite healthy. We did get a significant signal yesterday, a nice 9:1 down volume day. (A day when 90% of the volume on the market was negative). I have been waiting for that, in fact the lack of that signal was what convinced us that the low for this correction was not in yet last week.   I want a 2nd 9:1 day like in June to complete the selling.

 [Add chart when I get chance]

VIX also needs a rest. I am guessing a rebound is due with target at 1650 area.

  [Add chart when I get chance]


We have one more chance to reallocate and clear some unwanted positions. I will wait patiently for the next signal.

Here is another reading on the similar indicator.

http://www.thereformedbroker.com/2013/08/28/chart-o-the-day-significance-of-90-down-days/

90 percent down day

Thursday, August 22, 2013

Thursday Morning Reading

How We Get to S&P 1800

1 thing I agree with is the market should not be too weak. I also see "S&P 1800 before 1400."

How’s The Long Term Health of The S&P 500 Looking?

Long term support at 1550. Even bearish as I am, I don't see 1550 in near term. 

Technicals and Seasonals Suggest Late August Bounce

Possible.

News Headline:
Fed's Jackson Hole summit begins today but with Bernanke not in attendance. What's my expectation? No major decisions expected to be made. Non-event again. They are going to defer the decision making until they cannot.

Wednesday, August 21, 2013

Event or not

Ahead of the FED minutes, I am sitting in my office and guessing, will this be an event or not. I think the SP index is posed for both sides. If tapering starts, it will go to 1600 in very short period of time. If it is not, a rebound is likely due sooner or later. I believe the up target is around 1670s.

Is it time to go long? I don't think so because we are going to face the same situation next month. It is time to re-allocate and re-balancing. For the rebound, builders, mortgage industry, financials may have good chance. In the long run, I still prefer technology, industrial and discretionary spending.

Wednesday, August 14, 2013

Market Breadth


Quote of the day:

“Markets can remain irrational a lot longer than you and I can remain solvent.”


 Me down at beach enjoying sunshine (if I can spot any). Life is good. The only reason I want to make this post is I come across the quote above today. In other words, don’t fight the trend just because you believe it should be going in the other direction. Usually the market does not moves in a straight line, but we know in 2013 that the Fed’s balance sheet was going to expand in a straight line and U.S. stocks have been more highly correlated to the Fed’s balance sheet than ever. If it has to go up, then just let it go up.
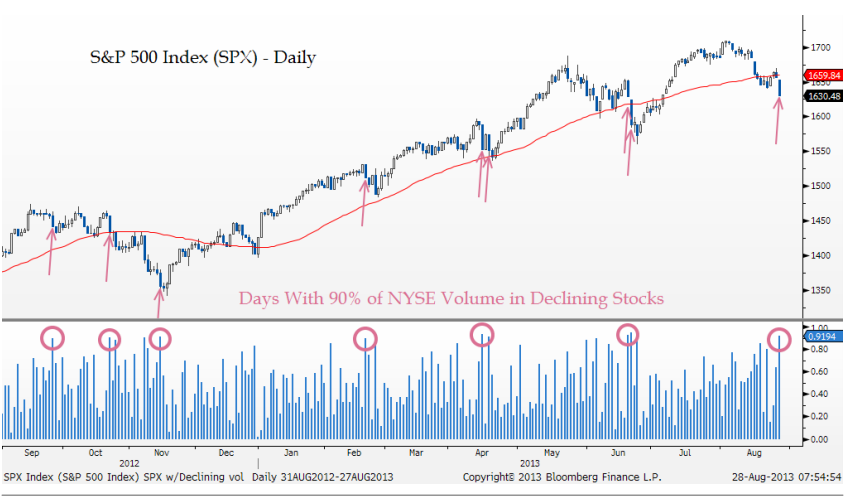
S&P 500 Index (SPX)
The advance to 1710 on August 2 is beginning to look like a potential Head of a small Head & Shoulders Top pattern. If set off by a close back below 1680 the minimum downside measuring objective will be 1650s. Since trends require increasing open interest, when it declines as the futures make new highs it signals profit taking by the bulls as they close positions. Since the top at 1710, I see continuous decline in Open Interest. Although volume is lighter than normal in August, declining open interest is a good reason to start watching for a potential trend change.
When the VIX index is low and starts advancing, the SPX tends to top. There is chance VIX is turning. A close above 14 would be a good reason to consider implementing some hedges.

[to add chart]

Breadth of the market
This market is hard to trade recently. One observation is the weak market breadth. Recently a lot of technical blogs are talking about Hindenburg Omens. I discussed it before. Here is the wiki link in case you want to read.

There are a number of criteria that set off a Hindenburg Omen, I am not sure if I totally understand it. Here is my quick and dirty explanation. It occurs when the market index is trending higher, but there are more declining stocks than advancing stocks. It could also happen when there are an unusual high number of new 52-week lows in an up-trend market. Last week we saw Hindenburg Omen four times out of the five trading day week. In fact, the last time we’ve had so many HO so closely together was in November 2007 after the S&P 500 had put in a multi-year peak.

The most common index for breadth is NYSE McClellan Summation Index. It declined every day for the last two weeks creating a divergence as the NYSE Composite Index advanced. As a reliable leading indicator, the decline reflects more issues declining than advancing. 

 [to add chart]

Until breadth improves, I am going to delay new long positions and start considering hedge ideas. I don’t know how high the S&P 500 can go, but I know that it can go farther than most people believe it can and the top indicator continues to trend higher. I am expecting to add my long when S&P 500 getting close to 1,600.

Monday, August 5, 2013

Why exit Real Estate

Plan for this week:
With the Q2 earnings season winding down and nothing major on the economic calendar in the coming days, the stock market may simply be lacking in catalysts. After last week’s mixed economic data, it is hard to tell direction. The uncertainty comes from Friday’s soft jobs report. Normally a miss expectation job report should lead the market down a lot. This is going to be offset by the possibility of the tapering event. The bad part here is the report failed to throw up any evidence of improvement in the economy, it wasn’t bad enough to stop the Fed from contemplating the ‘Taper’.

Again, I think the overall market is efficient at this moment. Investors seem to be hoping that everything will continue breaking out in favor of stocks.  This week is going to be earnings driven. Good earnings will drive up. It has played out that way lately since people believe improved economic growth and stronger corporate earnings will offset higher interest rates.


This week's ER schedule is not very exciting. The research I subscribed gives me 14 shorts vs 4 longs. I am going to trade couple. If I have time I will post here.


--------------------------------------------------


I received a question on why I exit RE even though the signal is still positive. I found a chart from Kimble which explains it pretty well. This is not a good time to invest in RE for a prudent investor like me.


Sunday, August 4, 2013

LMP Aug 2013

The 5 IVY portfolio components are 

  • SP 500 (Risk ON
  • MSCI EAFE (The Most Famous International Index) (Risk off)
  • U.S. 10-Year Government Bonds (Risk off) / USD (Risk off)
  • NAREIT (U.S. Real Estate Index) (Risk ON)
  • SP GSCI (Goldman Sachs Commodity Index) (Risk off) / GLD (Risk off)
  • US Dollars / UUP (Risk ON)  

There is no change from last month. In the charts below, the lighter color Moving Average is 200 Day, which is very close to the IVY Portfolio setup. 
In my last post, I posted a quick note from GS on bond yield. There is no doubt the FED is going to tape the money flow very soon. In the near future, they can reduce bond purchase and increase interest rate. Currently in the market, it is widely expected September is the month it will start.
Nevertheless, USD is going to go up, and everything priced in USD will have a hit. Bond and commodity are obvious. Real Estate is a hidden one. International market maybe slightly different. If they can grow faster than USD appreciation, the stock will advance. I however do not see that at this moment. In the CFA book club, I was keeping on talking about China data and commodity correlation. China growth rate will not go lower, but it is just nominal. Screw it. The real situation is not good. They need at least another couple years to figure out what to do and fix the damage on negligence from last administration. 
 
What should we do? Again this is a million dollar question. This is what I do:
  • 20% in cash, (if USD is going up, things will be cheaper in the future. I want to keep some cash to buy things later. Does this one smell like the problem in Japan? I will follow the 12 month signal on this one.)
  • 20% in gold and silver miners, (refer to earlier posts of my view on precious metals. It's cheap now. It will be stabilized. )
  • 20% in SPLV the SP500 low volatility ETF, (Refer to my view on volatility. It has return of only 15% YTD but good enough for me.)
  • and the rest 40% in short term trading. (It's chasing Alpha time. Let's do it.)


Friday, August 2, 2013

Dodge and Duck

The market makes me uncomfortable. I am trying to lower my Beta today. Couple things I am doing, selling calls on couple high beta stocks as I discussed earlier. Then I did a beta weighting again and trying to use ES shorts to reduce my portfolio beta to 0.
This is a long process. I will definitely get the job done by COB today.
Over the weekend, I will update the LMP signals.

Before lunch addition: something is going on causing lost of info.
Hope this will work.