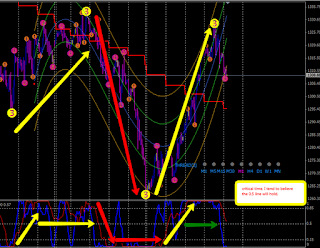
I have a tiny little bit problem in understanding the market. I cannot decide whether it will be another down leg. I add half of my equity position yesterday and plan to add another half when SPX reach 1290 again. Check the chart above for my plan.
Here is my hourly cloud chart. It is a confusing moment as quick cloud dip into slow cloud. I think 1300 area or the bottom of slow cloud should hold or it will be hard to do wave count.
Below are the 2 other charts I post frequently. Just pick whatever you like :D.


No comments:
Post a Comment