Wednesday, April 23, 2014

reading list

This is the mid-of month catch all. I will put ideas, readings and charts together here.

Tape reading

This is a chart I cut this morning. I read it as a bearish crab. In other words, unless we get some super power to take out the previous all-time high 1892.75, it will check the gravity. Recently with the momentum stock sell-off, new tech, bio, solar, and other hot names are all coming back from peak. Before the market finds new motion, I really cannot see a new high.

The pattern itself has a pretty big range. I marked 3 possible areas for pull back target. I am going to trade the range 1810-1875 (or 1800-1900 to be safe) for now. Again this is not a long term sell signal yet. If you really want to know what I do, pm me for discussion.


Interesting Stats

I found this from bespoke.com


From this table, we can see Tuesday is really bullish. Actually this table starts from this year. Per my count, Of the 17 Tuesdays since Dec 24th 15 have been up and only 2 down. Also Tuesdays account for 8.68% which is also impressive. Tuesday and Thursday are positive, the other 3 are on average negative. Go figure.

Goldman's forecast

With all of that in mind, here are Goldman Sachs' current forecasts for the U.S. economy and every major financial asset class in the world. It comes from David Kostin's new US Weekly Kickstart note.


Other readings

In spite of these challenges, investment strategies have tried to benefit from such inefficiencies. The two most common approaches investors have used are to wager that the macro inefficiency will continue to magnify or that it will revert. The first is a momentum or trend-following exposure while the latter is a contrarian or reversion exposure. As mentioned earlier, both these approaches need patience, ample reserves and nerves of steel. 

Americans still don't trust the stock market

The survey of over 1,000 households by Bankrate.com showed that 73% are "not more inclined to invest in stocks.

While stocks are prone to boom and bust cycles, experts say a well balanced portfolio is the best way to grow wealth over a long period of time."Investing over period of years in diverse portfolio is the pathway to financial stability,"


THE “STOCK PICKER’S MARKET” FALLACY

Overall, most investors would do well to ignore the allure of “stock picking” and any notion that they have an innate ability to pick winning stocks. I know this may be hard to accept but it should be somewhat easier when you look at the performance of most institutional stock pickers who suffer from the same behavioral foibles. This is not to say that it is impossible pick winning stocks as there are certainly great stock pickers in existence. However, the casual investor with no process or strategy is highly unlikely to be among them. It is never a “stock picker’s market” for these investors.
Fortunately, though, stock picking is not a prerequisite to successful investing. In fact, it is the antithesis of successful investing for many. For most investors, instead of “doing their homework” in trying to find the next Google or Apple, they should be developing an appropriate asset allocation plan and sticking to it. While not as exciting as jumping aboard the latest 3D printing or biotech breakout, it is likely to be significantly more profitable in the long run.

Monday, April 7, 2014

bottoming or not

Today ES, the SP500 futures draw a quick bottom around 1833 which happened to be 3/27 low. So far I believe it is bottomed for now. IMO, it is a good quality 1on1, pointing at high 1850s. On the chart I listed couple supporting levels.


The next chart is silver daily. As I mentioned last time, I am playing the Gartley reversal. My target is still 21.50


Thursday, April 3, 2014

LMP March 2014

The 5 portfolio components signals are

  • SP 500 (Risk ON) 
  • MSCI EAFE (The Most Famous International Index) (Risk ON)
  • U.S. 10-Year Government Bonds (Risk off) 
  • NAREIT (U.S. Real Estate Index) (Risk ON)
  • SP GSCI (Goldman Sachs Commodity Index) (Risk ON) / GLD (Risk off)
  • US Dollars / UUP (Risk off)  


In the charts below, the lighter color Moving Average is 200 Day, which is very close to the IVY Portfolio setup. This month is trick as couple charts need further consideration. 


1. SPY  
I truly believe 2014 will be a stock picker's market. Overall economy will recover and getting better. Overall stock market performance will not be as crazy as last year. Again, it is time to forget Beta and searching for Alpha. As a result, I will still looking for individual stocks to invest, rather than park in SPY, the SP500 ETF. I will post a chart of my view on SPY/SPX/ES later. Basically I think there is a small correction due right in front of the historic high on ES. Job report this Friday could be a trigger for that.

According to STA, April is the best month for equities. Here is a review of March sectors:


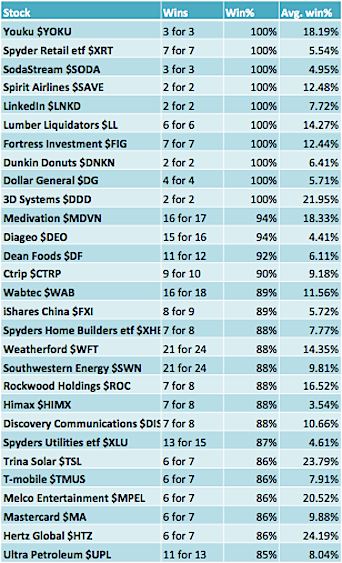
Here is a list of stocks showing strong seasonality in April.

A couple of items worth noting: Energy names Weatherford (WFT) and Southwestern (SWN) have produced positive gains in 21 out of 24 occurrences in the month of April. The average win% for Weatherford has been 14.35% and 9.81% for Southwestern – now that’s some strong April seasonality! As well, the Retail Index (XRT) has not had a losing April in its young history (7 ofr 7).

Here is the link 

2. DEM / EEM
The crisis in Ukraine continues to be fought on the diplomatic and public relations fronts. Russia 
continues to station 40,000 troops on the Ukranian border. Meanwhile, Russian Foreign Minister 
Sergey Lavrov is on record as saying, “We have absolutely no intention of, or interest in, crossing 
Ukraine’s borders.”
Emerging market is recovering and just took the 200MA as I mentioned in my last post. I went in using option combos on EEM. The trend change is largely led by Turkey and Brasil. I am looking for stocks too. Below is a list of countries I like and the ETF ticker:
Vietnam (VNM), Thailand (THD), Indonesia (EIDO), 
Turkey (TUR), Poland (EPOL), 
Brazil (EWZ), Colombia (GXG) and Mexico (EWW). 
I also think frontier markets (FM) continue to make sense, particularly for those seeking portfolio diversification. Another attractive way to play emerging markets is with the bonds; the most liquid of which are the PCY and EMB ETFs. 

3. TLT
I'm out of bonds for couple months. Even though it is now very close to buy signal, I decide not to take it. I park my money at some "bond" like equities, such as Private Equity and Mortgage Servicer and Insurance Companies. Another alternative can be municipal funds. I need time to explore that area.

4. Real Estate
No major change other than I moved some capital into some stocks such as builders and investors.

5. Commodity
Still risk on, but the price action is weakened by strong dollar. Not sure how long it will be. I am in favor of energy and agricultural stocks. I also think gold miners may get a chance. I will post my charts later.
I continue to favor long positions in corn (CORN) and agriculture (DBA). I also like being short crude oil (USO) and continue to favor a short position in natural gas (UNG). 


Wednesday, March 26, 2014

quick update - EEM SLV


The world is uneasy in the past couple weeks. The market is volatile. My view is "the short term market is weak but not enough to trigger mid- to long- term sell."

EEM is the ETF for emerging market. After the Ukraine crisis cool off a little, it is rebounding. I see a good year for the emerging market. I expect high 41s in short term.


SLV is the ETF for silver. I have been trading silver for couple months. I have a neutral position at this moment because there are lots of uncertainties in the metal market. It is OK to say IDK from time to time. I am Long term bullish. I modify my position when a buy is triggered which could be very soon.


Tuesday, February 18, 2014

reduce exposure

V shape again. No matter how much I love it, I feel ES / SPX is getting close to a stopping point. I reduced my exposure today.  Overall my target is still 1880. I want to buy at 1815. There is chance ES break out 1850 directly w/o correction. If it happens, I will chase.


Friday, February 7, 2014

Chart update

refine of my road map.


Monday, February 3, 2014

New Year, January Barometer, and so on

Portfolio Update

Oops I guess I missed yet another update. No change in signal for Jan, even with the sell off in the new year. As i described, my style of Ivy Portfolio is to adjust at the month end only, so even with today's crash, sell is not triggered yet.


Market View


On Jan 29, I posted the chart above. It is Daily chart of ES, which is the futures of S&P 500 index. We got a confusing signal in the new year. SPX made a new high, while ES didn't. My best explanation is the new high is not decisive. I still should read the chart as triple top. The headache is however lots of indicators give totally different reading. That's why I said I am not sure if bottom is in at 1780 and pointed out 1730 is a better support.


Here is the chart for today. Very unfortunately we are at 1730s now. It is very oversold at this moment. VIX spiked today. I think it could be a good bottom for this wave. I am guessing an upward correction to north of 1800, then form the next trend. I am going to update my VIX chart in a moment. If you hedge your portfolio using my vix>14 rule, you should book nice profit. I am unwinding this leg now.

January Barometer

Definition:
Devised by Yale Hirsch in 1972 our January Barometer (JB) states that as the S&P 500 goes in January, so goes the year. The indicator has registered only seven major errors since 1950 (all within secular bear markets) for an 89.1% accuracy ratio.
Market Talks: 
Ye Olde JB is negative. On top of this, DJIA closed below its December closing low of 15,739.43 on January 29. Both are ominous for this nearly 5-year-old bull market. Since 1950, this combination has occurred 21 times with declines going on to average –14.0%. Full-year performance was negative 14 times with all 21 years posting an average loss of –3.2%.


My Observation:
I checked recent years and I don't think I can get a clean statistical conclusion. I think in a bull market the bullish JB setup performed way better. (90%ish per STA.) In a bear market, the result is way more indecisive. If we look at bearish setup only, JB delivers a useless result, 52%. The most recent bearish JB signal happened in 2008, 2009 and 2010. It was only correct in 2008 and was miserable in 09 and 10. The only before that is 2003. It was bad again. My take is JB is good for trend following in bull market, but not that useful in trend change or bear market.

TBC