Friday, December 14, 2012

Gangnam Style - Certain Things to avoid

Here is news on Gangnam Style Dance.

There are certain things that middle-aged men should probably steer clear of: buying a flashy sports car, dating a barely-legal hottie, succumbing to the allure of hair-in-a-can.
However, this week, after the death of a British dad, experts now warn that dancing "Gangnam Style" may be yet another middle age no-no.
As the Sun notes, 46-year-old Eamonn Kilbride was performing the energetic dance -- made wildly famous by Korean pop star Psy -- at his office Christmas party over the weekend when he suddenly collapsed and died. 

 In order to prove I am not middle-aged yet, I think I should try the list above. I tried Gangnam style dance for about 2 minutes and I feel dizzy. After this news I decide to quit that crap, forever. Me no sporty-car type, but rather off-road kind. I don't want to change my style, at least for now. I am losing hair. Still better than my friend COB, but I don't think I want to do hair in a can. The only left-over is to date an illegal hottie. I am on my way to NYC. Let's see if I can do that. :D

The market is dancing in a way hard to predict. FED meeting is making it worse. I bot some options to protect my position and disclosed in last post. As planned I closed that hedge yesterday at sub-1420 level. Now we are all the same. Holding long positions, naked, and watching market falling. This is another I don't know moment. I guess and I hope 1407 will hold.
(Starting from now, I am using Mar 2013 ES, which is about 5 points below SPX.)

Tuesday, December 11, 2012

Quick update

I was looking for a dip to 1400 then a rally to 1430 in my monthly LMP update. So far I got both of them. Not sure what's next. I feel a pull back to 1420 area then for next move. I am using derivatives to play that. It is small, so long term investors don't have to take that action.

Monday, December 3, 2012

Monday morning news reading

I read this article from the big picture.

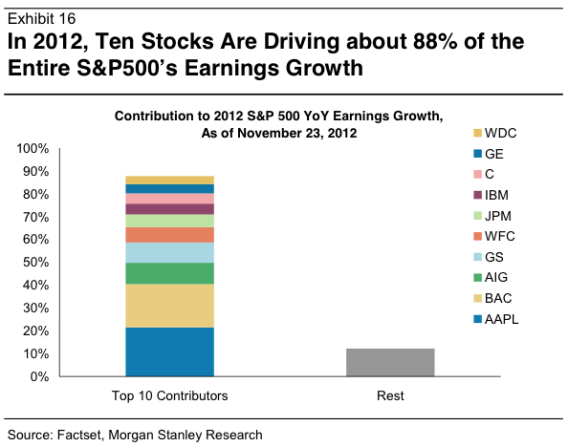
4 Companies Provided Half of SPX 2012 Earnings Growth


It notes that nearly 90% of this year’s earnings growth of the S&P 500 companies can be traced to 2% or 10 companies.Who are they? All those too big to fall names. Yeah.
There seems to be two industries, finance and technology. It is even more concentrated than the chart suggests.  Four companies–three financial services (AIG, Goldman and Bank of America) and one technology firm (Apple) provided over half of the earnings growth of the S&P 500.
If the next door papamama grocery grows slower than its banker, what does it suggest? Go figure.

December Low Indicator


Here is another one. Pure data analysis. Lucien Hooper, a Forbes columnist and Wall Street analyst back in the 1970s, noted that the trend could be random or even manipulated during a holiday season. If that low is violated during the first quarter of the New Year, it is frequently an excellent warning sign. In the link, 60 years of data were presented. It works 17 out 31.


More interestingly, I found it a prove to Jan Barometer as well. JB failed 6 times, out of 60 years history from 1950 to 2010. A 90% successful rate! 3 of the fails occurred in the last decade. All 6 occurred in YEARS DOW FELL BELOW DECEMBER LOW IN FIRST QUARTER.

Sunday, December 2, 2012

Low Maintenance Portfolio Update Dec 2012

No big change in view. No big deal, I think.

For the new month, I have everything on buy side.


The 5 IVY portfolio components are 
  • SP 500 (Risk ON) 
  • MSCI EAFE (The Most Famous International Index) (Risk ON)
  • U.S. 10-Year Government Bonds (Risk ON) / USD (Risk ON)
  • NAREIT (U.S. Real Estate Index) (Risk ON)
  • SP GSCI (Goldman Sachs Commodity Index) (Risk ON)/ GLD (Risk ON)
  • US Dollars (Risk off)
Since I stopped out on USD in September, I put 40% in Gold. Commodity is green this month. It is volatile, and the spread from MA is too small. I decide to leave my money in Gold. Similar case in international index. Why bother.  I also have 20% REIT and 20% Bond since beginning of the year. So far LMP return is 10.02% which is very close to a typical 40% Bond 60% equity allocation but with much lower volatility. 100% equity still wins with a shining 14% YTD return. Volatility? Let's skip that part.

What's different this month is I am holding 20% of SPY (It's the ETF for SP 500. It is 1/10 of SPX plus dividends) at 136 for 2 weeks now (refer to my 3-push pattern posts). This month, SPX actually dip below the MA then came back to form a hammer shape. To add at the signal line is not a violation to the LMP methodology.
I think it may face some short-term pressure. I am managing the risk by using some simple derivative strategy. I hope it could go up a little bit more, let's say 143ish.


 My plan is holding equity for Santa, then close out before Christmas.
 

Thursday, November 29, 2012

ECRI the leading indicator

Do Economic Indicators Show U.S. in Recession?

On Nov. 29, 2012, ECRL co-founder and COO Lakshman Achuthan displays economic indicators he believes to show that the United States in currently in recession. He speaks on Bloomberg Television's "Bloomberg Surveillance."

It is very self-explanatory. There are couple macro indicators discussed and showed here. Lakshman said recession started in July. Jobs is the only one not agreeing, the reason is contraction of labor force. He also mentioned in 3 of 7 the last recessions jobs increased into the recession.

When people asked other indicators, he said GDP is only quarterly, (which may not be up to date, and may be too slow to spot trend change) and stock market and risk assets give signals, but the signals are distorted here.

Tuesday, November 27, 2012

Monday, November 19, 2012

Update 11/19/2012

This market is getting harder to trade. Currently I break the movement down this way.
ES (the SPX futures) retreated to 1360 to reflect uncertainty about Obama's second term. Then the Israel news pushed 20 points further to 1340. Friday afternoon we got good news from the congress. SPX soar 20 points. Then over the weekend middle east cooled down. So now we are back at ES 1380 area.

1380-85 is a good resistance area, defined by last drop. There is a pretty reliable 1on1 bearish pattern on ES hourly. Also 200 day MA is at SPX 1382. These things are going to hold the market for a while. Then we can figure out which direction the market wants to go.

Add chart: