scary video, but very interesting and informative.
Wednesday, June 13, 2012

Friday, June 8, 2012
Charting the market
I have a tiny little bit problem in understanding the market. I cannot decide whether it will be another down leg. I add half of my equity position yesterday and plan to add another half when SPX reach 1290 again. Check the chart above for my plan.

Here is my hourly cloud chart. It is a confusing moment as quick cloud dip into slow cloud. I think 1300 area or the bottom of slow cloud should hold or it will be hard to do wave count.

Below are the 2 other charts I post frequently. Just pick whatever you like :D.
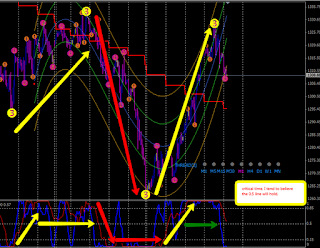


Here is my hourly cloud chart. It is a confusing moment as quick cloud dip into slow cloud. I think 1300 area or the bottom of slow cloud should hold or it will be hard to do wave count.

Below are the 2 other charts I post frequently. Just pick whatever you like :D.


Wednesday, June 6, 2012
I think it is bottomed
Overnight movement is convincing. I read the market as bottomed at 1270 area. /ES successfully took 1280 to confirm the bottom is in. I am expecting a recovery summer.
I will look for an entry point either today or tomorrow.
To add later.
I will look for an entry point either today or tomorrow.
To add later.
Friday, May 18, 2012
Hold off
Market is moving too fast and I am too busy recently. I didn't get chance to update my view when the market is at my first target of 1330.
SPX is approaching my original target around 1290 neighborhood. I expect more battle at 1300. I refine my plan to chase the market if 1300 is confirmed to be a short term bottom, but not to hold the falling knife.
When I say confirmed, I am thinking of a rebound to 1320-1325 area then back down to sub 1300 to make either a double bottom or a higher low.
SPX is approaching my original target around 1290 neighborhood. I expect more battle at 1300. I refine my plan to chase the market if 1300 is confirmed to be a short term bottom, but not to hold the falling knife.
When I say confirmed, I am thinking of a rebound to 1320-1325 area then back down to sub 1300 to make either a double bottom or a higher low.
Monday, May 7, 2012
Sell in May and walk away
The "Sell in May" strategy worked with a high success rate. I guess it works this year as well. Equity futures drop HUGE tonight, and now below the "Benanke-hint".
As expected.
The market need to "persuade" him to print more money. What really bothers me is still the correlation among products. Here are the latest reading of the over night futures market.
SPX 1342, check;
USD 80.1, check;
EURO 1.298 smile;
oil 95, wow;
gold 1638, what???
Enough said. No change in strategy. No change in plan. Good luck to all.
As expected.
The market need to "persuade" him to print more money. What really bothers me is still the correlation among products. Here are the latest reading of the over night futures market.
SPX 1342, check;
USD 80.1, check;
EURO 1.298 smile;
oil 95, wow;
gold 1638, what???
Enough said. No change in strategy. No change in plan. Good luck to all.
Sunday, April 22, 2012
Love the Earth, our mothership
Our planet, our home is being neglected. This Earth Day it's time to mobilize the planet from the ground up to send a message that the Earth won't wait!
Here are some pictures shot by Andre Kuipers, space station astronaut, from ISS. Check how beautiful it is. Hope it will be as beautiful many many years later.
http://www.telegraph.co.uk/technology/picture-galleries/9202815/Andre-Kuipers-space-station-astronaut-sends-pictures-to-Earth-via-Twitter.html?frame=2192333
Here are some pictures shot by Andre Kuipers, space station astronaut, from ISS. Check how beautiful it is. Hope it will be as beautiful many many years later.
http://www.telegraph.co.uk/technology/picture-galleries/9202815/Andre-Kuipers-space-station-astronaut-sends-pictures-to-Earth-via-Twitter.html?frame=2192333
Friday, April 13, 2012
Economy is yelling at Stock Market
I am getting a little bit lazy lately. Really I don't have much to say. The day before yesterday, Gary Shilling made a very good interview with Bloomberg TV. He said this is a liquidity driven market. The market's only focus is FED's sugar cane but not real growth. Yes you hear me right, the market is in sugar high. Fundamental is important, and it is not too great, but it is largely ignored. Economy is yelling to the stock market, don't be too fast.
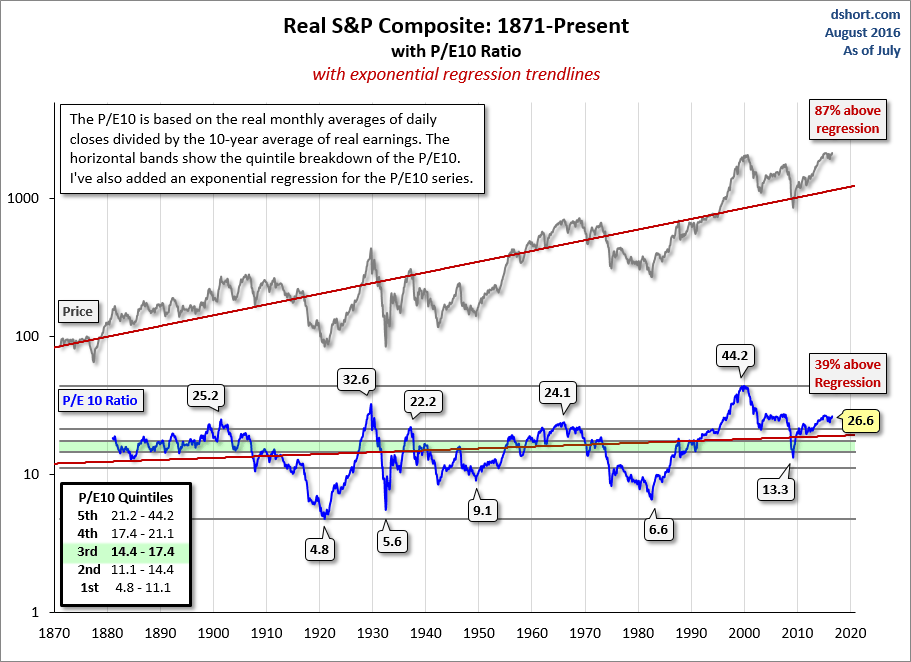
With liq, it will go up; if takes away it will go down. For the days market went up, you can always find news / hint / rumor saying the FED is implying QE3. For the days market went down, it's driven by the real economy data. What the market is fear of? No real earning growth. The earning growth for SP500 corporations in Q1 is 0%, and less than 2% in Q2. The stock market is running on a double digit rally. On those major financial TV channels, you will hear "experts" saying stocks are cheap because we have very low P/E ratio. The current TTM P/E is 15-16 which is pretty low, but how sustainable it is, how organic it is. We know in extreme, P/E ratio is always lagging and always flipping even faster than stock price. Doug Short wrote:
And Doug also provided a snapshot of where we at. It is very self-explanatory. Is it cheap? NO.

I am not in the class of desperate bears. I still think US economy is recovering. I still believe FED will deliver QE3 or in lieu. They are going to make decision when the current operation twist ends in June. The market, led by GS will ask for it. It will be bumpy next couple months. I still seek to buy low. Below is my road map I posted couple days ago. ES 1385-1390 area is about 50% to 61.8% of the current down leg. I will watch it to see if the current drop is just a bigger correction or it is trend change.

My plan is too add 50% of equity exposure when SPX at 1330 area, and add another half at 1290 (the 2 beams on chart).
Add: forgot to update my portfolio. Still no change as of 3/31/2012.
Bond, Gold, Equity, REIT, USD, Emerging market all risk on. I am still overriding the equity signal and put the money in USD.
Add: A video to share, title
Buy gold, short the Euro and be prepared for the big equities sell off
With liq, it will go up; if takes away it will go down. For the days market went up, you can always find news / hint / rumor saying the FED is implying QE3. For the days market went down, it's driven by the real economy data. What the market is fear of? No real earning growth. The earning growth for SP500 corporations in Q1 is 0%, and less than 2% in Q2. The stock market is running on a double digit rally. On those major financial TV channels, you will hear "experts" saying stocks are cheap because we have very low P/E ratio. The current TTM P/E is 15-16 which is pretty low, but how sustainable it is, how organic it is. We know in extreme, P/E ratio is always lagging and always flipping even faster than stock price. Doug Short wrote:
Legendary economist and value investor Benjamin Graham noticed the same bizarre P/E behavior during the Roaring Twenties and subsequent market crash. Graham collaborated with David Dodd to devise a more accurate way to calculate the market's value, which they discussed in their 1934 classic book, Security Analysis. They attributed the illogical P/E ratios to temporary and sometimes extreme fluctuations in the business cycle. Their solution was to divide the price by a multi-year average of earnings and suggested 5, 7 or 10-years. In recent years, Yale professor Robert Shiller, the author of Irrational Exuberance, has reintroduced the concept to a wider audience of investors and has selected the 10-year average of "real" (inflation-adjusted) earnings as the denominator. As the accompanying chart illustrates, this ratio closely tracks the real (inflation-adjusted) price of the S&P Composite. The historic average is 16.4. Shiller refers to this ratio as the Cyclically Adjusted Price Earnings Ratio, abbreviated as CAPE, or the more precise P/E10, which is my preferred abbreviation.
And Doug also provided a snapshot of where we at. It is very self-explanatory. Is it cheap? NO.
I am not in the class of desperate bears. I still think US economy is recovering. I still believe FED will deliver QE3 or in lieu. They are going to make decision when the current operation twist ends in June. The market, led by GS will ask for it. It will be bumpy next couple months. I still seek to buy low. Below is my road map I posted couple days ago. ES 1385-1390 area is about 50% to 61.8% of the current down leg. I will watch it to see if the current drop is just a bigger correction or it is trend change.

My plan is too add 50% of equity exposure when SPX at 1330 area, and add another half at 1290 (the 2 beams on chart).
Add: forgot to update my portfolio. Still no change as of 3/31/2012.
Bond, Gold, Equity, REIT, USD, Emerging market all risk on. I am still overriding the equity signal and put the money in USD.
Add: A video to share, title
Buy gold, short the Euro and be prepared for the big equities sell off
Subscribe to:
Posts (Atom)