Thursday, February 17, 2011

2/17

Follow up on AKAM. So far so good. On hour chart I read a clear rejection at 43.6 level. I am kinda thinking a channel break out. Somebody says after hour should not count. Let's wait and see then.


Today I want to add 1 more chart. I mean to check out LNG for a possible rumor play. By mistake I landed on LNN. Like the chart. Another short setup? Am i bearish now? Well I don't know. :D

Tuesday, February 15, 2011

AKAM - a flag to breakout

Akamai Technologies, Inc. provides services for the delivery of content and business processes over the Internet for businesses, government agencies, and other enterprises. It offers services and solutions for content and application delivery, application performance services, on demand managed services, and business performance management services based on its technological platform, EdgePlatform.

AKAM @ Yahoo Finance | AKAM Option @ Yahoo Finance

AKAM issued earnings on 2/10 and got hammered. The daily chart explained why I bet on the low side on ER.


In the past couple days, it is crawling up, on Ericsson (ERIC) news and probably also because of Cramer's pump.
I, however, don't buy it. I see a potential bearish flag forming. The setup will become active on a breakdown below the bottom of the pattern at $41.88. If the pattern becomes active, downside potential for the pattern is to the $36.5 area, then possibly $30.

Thursday, February 10, 2011

my baby NFLX

NFLX is my baby. I found it since 2007. Use it, love it, invested in it. I closed my position late 2010 since it reached my valuation target of 200. This earning season, I estimated 2011EPS to be $4.60 and with an average multiplier of 46.6x observed for the past 3 years, I gave NFLX a target of 210-220.

Today I noted Whitney Tilson's T2 capitulated on NFLX shorts. Below are the extracts from the letter.

    In mid-December, we published a lengthy article on why Netflix was our largest bearish bet at the time. With the stock up nearly 25% since then, one might assume that we’d think it’s an even better short today, but in fact we have closed out our position because we are no longer confident that our investment thesis is correct.

    1) The company reported a very strong quarter that weakened key pillars of our investment thesis, especially as it relates to margins;

    2) We conducted a survey, completed by more than 500 Netflix subscribers, that showed significantly higher satisfaction with and usage of Netflix’s streaming service than we anticipated (the results of our survey are in Appendix A, attached); and

    3) Our article generated a great deal of feedback, including an open letter from Netflix’s CEO, Reed Hastings, some of which caused us to question a number of our assumptions.

    In summary, while we acknowledged in our December article that Netflix “offers a useful, attractivelypriced service to customers, is growing like wildfire, is very well managed, and has a strong balance sheet,” we now believe that it is an even better business than we gave it credit for. The company has enormous momentum and substantial optionality (for example, international growth), and management is executing superbly. In particular, we tip our hat to Reed Hastings, whom we had the pleasure of meeting last weekend. In addition to his success building the business and navigating the transition from DVD-by-mail to streaming media, he’s also one of the most down-to-earth, honest and straightforward CEOs we’ve ever encountered.

Based on the data provided in the T2 letter, I upgrade my target of NFLX to 235.

Monday, February 7, 2011

Key Levels to watch

The Market is rallying on below average volume and extreme sentiment. How long will it last? Bernanke may not know either.

Saturday, January 22, 2011

AMZN - broken chart

I love AMZN. I did a lot of shopping over there. In fact I even have premium membership.
However the chart of AMZN is ugly. I don't mind making some money of short it.
This is my weekly count. I believe wave 5 is concluded.


On the daily chart, it's an obvious trend changing to me.


One more chart.
I believe AMZN will touch 150-160 zone in late March or April.

Thursday, January 6, 2011

New Year Resolution 1

Man, I have been away from this place for too long.

What should I say? 2010 was a good one. May we have a better 2011.
A chart to share. A big one. I mean huge in size.

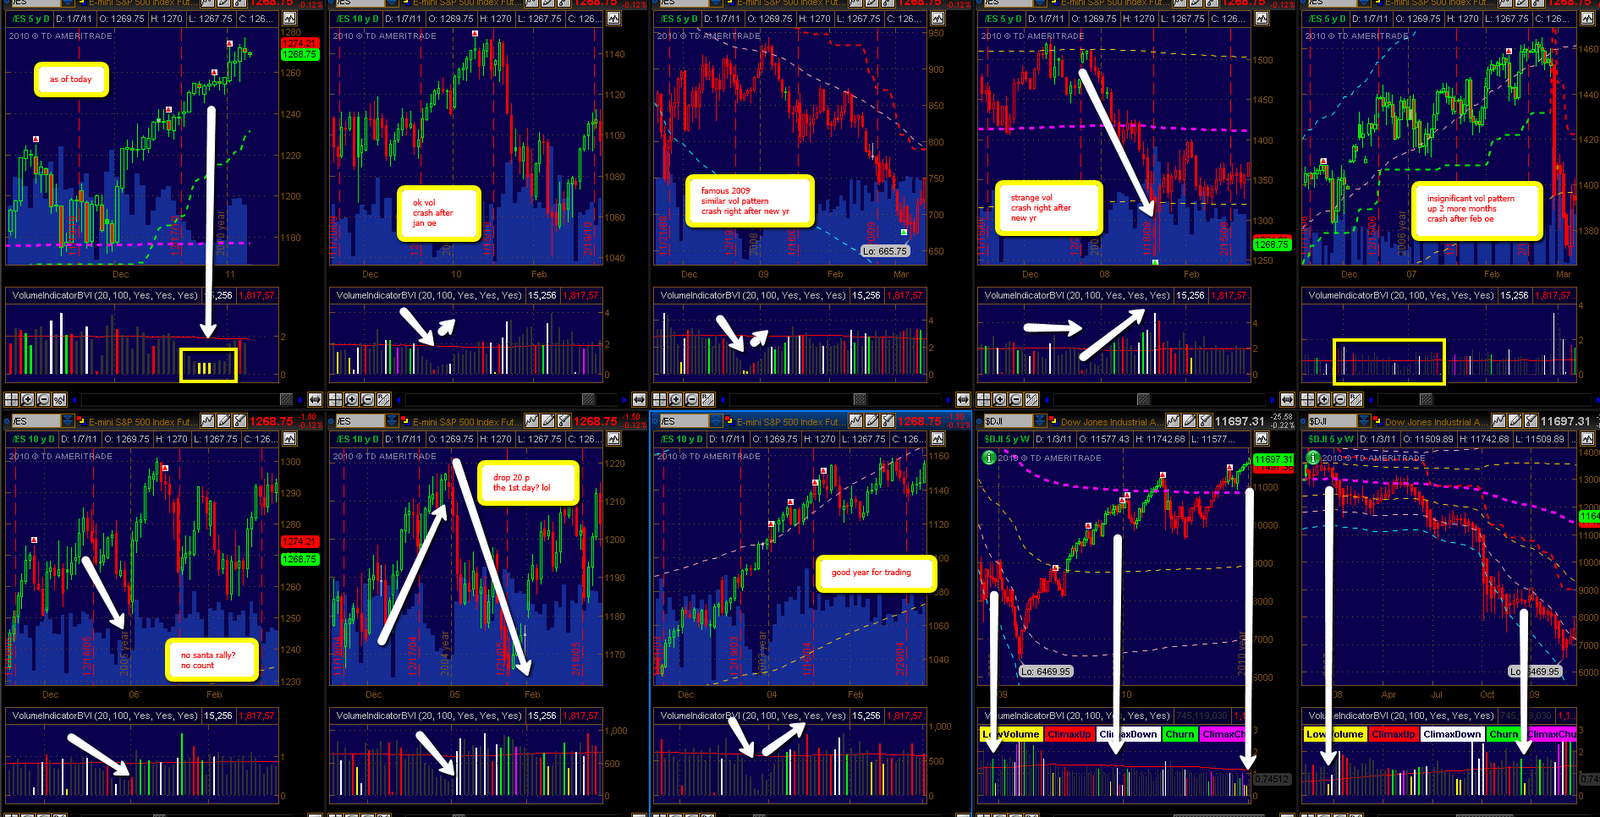
In the following chart, I reviewed Volume Pattern at the Year Turn for the past couple years. In particular, I pay attention to the relationship between price and volume from Nov OE to Jan OE. I should say there are a lot in common.
Let's rewind to 2003. At the end of 2003, volume dried out at Christmas time, then pick up a little bit in the last 2 trading days (hereinafter VP1). It had a strong January with rising into OE. Over all it was a good period for trading.
In 2004,  things were different. Volume dropped for the entire holiday season (VP2), while price shot straight up. The ES gained over 50 points since Nov OE. Right after we turned to 2005, a sharp drop kicked in. ES lost 55 points to Jan OE.
2005 was a strange year w/o Santa Rally. I don't want to recall that year.
At the end of 2006, the volume pattern was not recognizable. I guess it's TOS, but not the market. Anyway ES gained 60 points from Nov OE to Feb with no significant pull back. Then bear roared 100+ points in late Feb.
Now we in 2007. It was a good year. S&P printed the historic high. But not the year end. Bears kicked in right after Xmas. SPX lost over 200 points from Dec OE to Jan OE. That's the start of the very 'short-lived' recession. (Yes that's what we were told.)
In miserable 2008, we eventually got Santa rally which started right after Nov OE. After the turn of the year, we got an even worse 2009. What happened in 2009 stayed in 2009. No comments.
2010 was no good either. Santa brought us 50 points with VP1 to Jan OE, then the market took 100 points back.
Now we at Jan 7, 2011. Market recorded another VP2. What's next?

Monday, November 29, 2010

range after range

This market is boring. Range after range. We stayed in 1173-1200 zone for a while. A rectangle or a descending triangle is forming. BUT it is nor exciting either. Outside of this one is a bigger range of 1150-1220.
Let's wait and see.

carry on charts.