I love AMZN. I did a lot of shopping over there. In fact I even have premium membership.
However the chart of AMZN is ugly. I don't mind making some money of short it.
This is my weekly count. I believe wave 5 is concluded.
On the daily chart, it's an obvious trend changing to me.
One more chart.
I believe AMZN will touch 150-160 zone in late March or April.
Saturday, January 22, 2011
Thursday, January 6, 2011
New Year Resolution 1
Man, I have been away from this place for too long.
What should I say? 2010 was a good one. May we have a better 2011.
A chart to share. A big one. I mean huge in size.
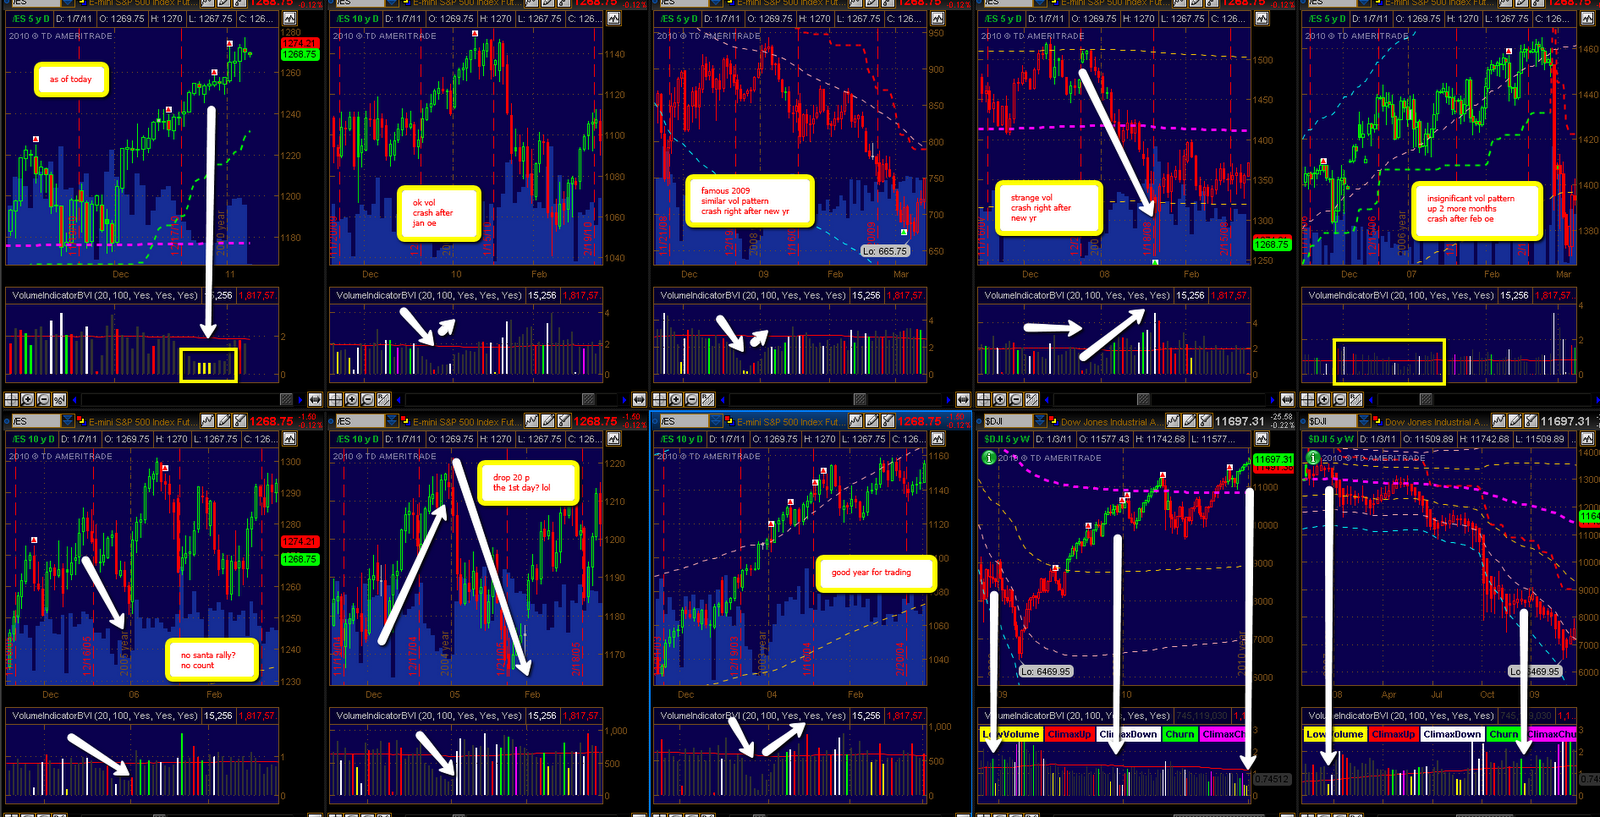
In the following chart, I reviewed Volume Pattern at the Year Turn for the past couple years. In particular, I pay attention to the relationship between price and volume from Nov OE to Jan OE. I should say there are a lot in common.
Let's rewind to 2003. At the end of 2003, volume dried out at Christmas time, then pick up a little bit in the last 2 trading days (hereinafter VP1). It had a strong January with rising into OE. Over all it was a good period for trading.
In 2004, things were different. Volume dropped for the entire holiday season (VP2), while price shot straight up. The ES gained over 50 points since Nov OE. Right after we turned to 2005, a sharp drop kicked in. ES lost 55 points to Jan OE.
2005 was a strange year w/o Santa Rally. I don't want to recall that year.
At the end of 2006, the volume pattern was not recognizable. I guess it's TOS, but not the market. Anyway ES gained 60 points from Nov OE to Feb with no significant pull back. Then bear roared 100+ points in late Feb.
Now we in 2007. It was a good year. S&P printed the historic high. But not the year end. Bears kicked in right after Xmas. SPX lost over 200 points from Dec OE to Jan OE. That's the start of the very 'short-lived' recession. (Yes that's what we were told.)
In miserable 2008, we eventually got Santa rally which started right after Nov OE. After the turn of the year, we got an even worse 2009. What happened in 2009 stayed in 2009. No comments.
2010 was no good either. Santa brought us 50 points with VP1 to Jan OE, then the market took 100 points back.
Now we at Jan 7, 2011. Market recorded another VP2. What's next?
What should I say? 2010 was a good one. May we have a better 2011.
A chart to share. A big one. I mean huge in size.
In the following chart, I reviewed Volume Pattern at the Year Turn for the past couple years. In particular, I pay attention to the relationship between price and volume from Nov OE to Jan OE. I should say there are a lot in common.
Let's rewind to 2003. At the end of 2003, volume dried out at Christmas time, then pick up a little bit in the last 2 trading days (hereinafter VP1). It had a strong January with rising into OE. Over all it was a good period for trading.
In 2004, things were different. Volume dropped for the entire holiday season (VP2), while price shot straight up. The ES gained over 50 points since Nov OE. Right after we turned to 2005, a sharp drop kicked in. ES lost 55 points to Jan OE.
2005 was a strange year w/o Santa Rally. I don't want to recall that year.
At the end of 2006, the volume pattern was not recognizable. I guess it's TOS, but not the market. Anyway ES gained 60 points from Nov OE to Feb with no significant pull back. Then bear roared 100+ points in late Feb.
Now we in 2007. It was a good year. S&P printed the historic high. But not the year end. Bears kicked in right after Xmas. SPX lost over 200 points from Dec OE to Jan OE. That's the start of the very 'short-lived' recession. (Yes that's what we were told.)
In miserable 2008, we eventually got Santa rally which started right after Nov OE. After the turn of the year, we got an even worse 2009. What happened in 2009 stayed in 2009. No comments.
2010 was no good either. Santa brought us 50 points with VP1 to Jan OE, then the market took 100 points back.
Now we at Jan 7, 2011. Market recorded another VP2. What's next?
Monday, November 29, 2010
range after range
This market is boring. Range after range. We stayed in 1173-1200 zone for a while. A rectangle or a descending triangle is forming. BUT it is nor exciting either. Outside of this one is a bigger range of 1150-1220.
Let's wait and see.
carry on charts.
Let's wait and see.
carry on charts.
Tuesday, October 19, 2010
Wednesday, September 29, 2010
Gold to 1325
It’s time to admit summer is over no matter how much I want to stop the clock. Bye-bye good summer. It’s time to go back to work and get ready for the next vacation season.
Alright, it’s time to do an update. Gold gave us good return. I called for a mid-term reversal back in early August. My gang and I exit equity around 1120 and long gold at around 1170. SPX did a huge swing 1130-1040-1150 since then. We didn’t have any fun here but our experience with gold is good enough. We are experiencing the historical high with our longs. My current target is 1325 and I am expecting it this week! What I am really saying is I expect the last spike then mid-term consolidation. Why I say that? Gold is priced in currency. It is true Gold is keeping on making new high. BUT, the new high is only in USD, not any other currencies. It is safe to say it is the crash of USD, and because of the imbalance among major currencies I upgrade my target to 1325 from 1305.
Next, will USD keep on dropping? I don’t think so. JPY hits historical low at 83? Tell those Japanese about it. Apparently they don’t agree, and they start selling their own money. Same thing happened in Korea, in Switzerland for what we know.
Even EUR. Since 9/10, EUR booked a gain of 6.25%.
Below is a report from Brown Brothers.
"After rallying about 6.25% since September 10, the euro may enter a consolidative phase before advancing into the $1.38-$1.40 area in the first half of Q4. However, the euro may then surrender those gains in the second half of the quarter, as QEII is discounted (or not delivered at all), and the loss of economic momentum in Europe, ahead of a 2011 fiscal contraction, keeps debt restructuring fears elevated. The increased possibility that the EFSF has to be drawn upon may also spur speculation that the ECB may not be in a position to remove its emergency liquidity provisions; and indeed may have to actually embark on either more bond purchases or take some additional measures. All this may leave the euro trading around $1.30, if not lower, by year's end."
I don’t totally agree with their conclusion, but I also think the bounce of USD is coming even if the QE2 crap is exactly as the market priced in (needless to say if there is any discount). I utilized my economic model and I also calculate the fair value of EUR to be around 1.30+. My guestimation system sees a mid-term top of EUR at 1.368-1.374.
Friday, July 9, 2010
Friday, July 2, 2010
Mid-year Self Review
Per the request of my friend A.A, I did a self review here.

On Nov 16, 2009 I started this place with my very first post Reading of DOW.
In that post I threw in a chart like this
and I said "I calculated the upper limit to be 11245".
9 months passed by, here is how the chart looks like:
The peak is actually 11258. Damn, I missed 13 Dow points.
From the chart, I believe now is a good time to conclude P3 has already started.
Recently I believe I improved a little bit.
On Monday 6/28/2010, around 2:00 I made a post like this.
The low was 1010.91. This time I miss less than 1 point.
~_*
On Nov 16, 2009 I started this place with my very first post Reading of DOW.
In that post I threw in a chart like this
and I said "I calculated the upper limit to be 11245".
9 months passed by, here is how the chart looks like:
The peak is actually 11258. Damn, I missed 13 Dow points.
From the chart, I believe now is a good time to conclude P3 has already started.
Recently I believe I improved a little bit.
On Monday 6/28/2010, around 2:00 I made a post like this.
The low was 1010.91. This time I miss less than 1 point.
~_*
Subscribe to:
Posts (Atom)